Landsat 8 Bands and Band Combinations
Landsat 8 Bands and Band Combinations
Today, we will list the Landsat 8 bands as well as their most popular band combinations.
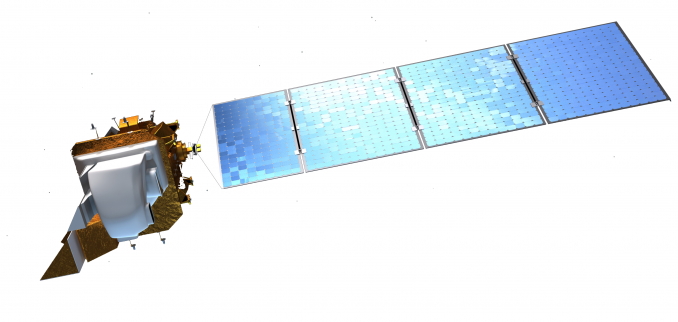
The two main sensors for Landsat 8 are the Operational Land Imager (OLI) and Thermal Infrared Sensor (TIRS).
The Operational Land Imager (OLI) produces 9 spectral bands (Band 1 to 9) at 15, 30, and 60-meter resolution.
Then, the Thermal Infrared Sensor (TIRS) consists of 2 thermal bands with a spatial resolution of 100 meters.
Band Designations for Landsat Satellites
Here are the Landsat satellite band designations for the Operational Land Imager (OLI) and Thermal Infrared (TIRS) sensor. They offer a standardized way to describe the spectral characteristics and capabilities of each sensor on Landsat.
Landsat-8 OLI & TIRS Sensors
| Band Number | Description | Wavelength | Resolution |
| Band 1 | Coastal / Aerosol | 0.433 to 0.453 µm | 30 meter |
| Band 2 | Visible blue | 0.450 to 0.515 µm | 30 meter |
| Band 3 | Visible green | 0.525 to 0.600 µm | 30 meter |
| Band 4 | Visible red | 0.630 to 0.680 µm | 30 meter |
| Band 5 | Near-infrared | 0.845 to 0.885 µm | 30 meter |
| Band 6 | Short wavelength infrared | 1.56 to 1.66 µm | 30 meter |
| Band 7 | Short wavelength infrared | 2.10 to 2.30 µm | 60 meter |
| Band 8 | Panchromatic | 0.50 to 0.68 µm | 15 meter |
| Band 9 | Cirrus | 1.36 to 1.39 µm | 30 meter |
| Band 10 | Long wavelength infrared | 10.3 to 11.3 µm | 100 meter |
| Band 11 | Long wavelength infrared | 11.5 to 12.5 µm | 100 meter |
Operational Land Imager (OLI) generates 9 spectral bands (Band 1 to 9) and is onboard Landsat-8. OLI images can discriminate vegetation types, cultural features, biomass, vigor, etc.
Thermal Infrared Sensor (TIRS) consists of 2 thermal bands with a spatial resolution of 100 meters. TIRS measures Earth’s thermal energy particularly useful for tracking how land and water are being used.
Landsat-7 Enhanced Thematic Mapper
| Band Number | Description | Wavelength | Resolution |
| Band 1 | Visible blue | 0.45 to 0.52 µm | 30 meter |
| Band 2 | Visible green | 0.52 to 0.60 µm | 30 meter |
| Band 3 | Visible red | 0.63 to 0.69 µm | 30 meter |
| Band 4 | Near-infrared | 0.76 to 0.90 µm | 30 meter |
| Band 5 | Near-infrared | 1.55 to 1.75 µm | 30 meter |
| Band 6 | Thermal | 10.4 to 12.3 µm | 60 meter |
| Band 7 | Mid-infrared | 2.08 to 2.35 µm | 30 meter |
| Band 8 | Panchromatic | 0.52 to 0.90 µm | 15 meter |
Enhanced Thematic Mapper Plus (ETM+) is a sensor on Landsat-7. It generates 8 spectral bands in blue, green, red, NIR, and mid-infrared (MIR). Bands 1-5 and 7 have a 30-meter resolution. The panchromatic (band 8) has a 15 m resolution. The thermal band has a 60-meter resolution.
Landsat-5 & 4 Thematic Mapper
| Band Number | Description | Wavelength | Resolution |
| Band 1 | Visible blue | 0.45 to 0.52 µm | 30 meter |
| Band 2 | Visible green | 0.52 to 0.60 µm | 30 meter |
| Band 3 | Visible red | 0.63 to 0.69 µm | 30 meter |
| Band 4 | Near-infrared | 0.76 to 0.90 µm | 30 meter |
| Band 5 | Short-wave infrared | 1.55 to 1.75 µm | 30 meter |
| Band 6 | Thermal | 10.4 to 12.3 µm | 120 meter |
| Band 7 | Short-wave infrared | 2.08 to 2.35 µm | 30 meter |
Thematic Mapper (TM) was a high-resolution scanner on Landsat satellites (Landsat 4 and 5). It collected images in visible, near-infrared, mid-infrared, and thermal bands with a spatial resolution of 30 meters.
Landsat-3, 2 & 1 Multispectral Scanner
| Band Number | Description | Wavelength | Resolution |
| Band 4 | Visible green | 0.5 to 0.6 µm | 60 meter |
| Band 5 | Visible red | 0.6 to 0.7 µm | 60 meter |
| Band 6 | Near infrared | 0.7 to 0.8 µm | 60 meter |
| Band 7 | Near-infrared | 0.8 to 1.1 µm | 60 meter |
Landsat has persistently enhanced the number of spectral bands and spatial resolution over the years. Over the years, it’s also ensured similar spectral resolution for each Landsat satellite.
From Landsat-1 to 3, the multispectral scanner collected data in four bands at 60-meter resolution. But over time, the spectral and spatial resolution has gradually sharpened. Landsat-8 collects 11 spectral bands varying from 15-meter to 100-meter resolution.
Multispectral Scanner (MSS) collected data in green, red, and two near-infrared bands with a 60-meter pixel size. The swath width was 185 km with 18-day repeat coverage.
Operational Land Imager (OLI)
This is the same information as in the table above but broken down by each sensor. On board Landsat-8, OLI generates 9 spectral bands (Band 1 to 9). Landsat 8 bands from the OLI sensor are coastal, blue, green, red, NIR, SWIR-1, SWIR-2, and cirrus.
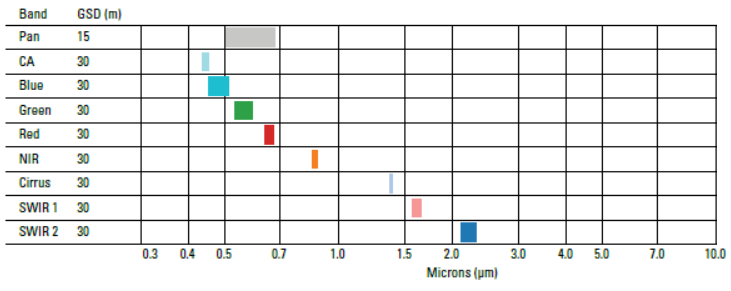
These 8 bands have a ground resolution of 30 meters. Then, the panchromatic band has a finer resolution of 15 meters.
Thermal Infrared Sensor (TIRS)
TIRS is the first of its kind in the Landsat program. In other words, this type of sensor did not exist before Landsat 8.
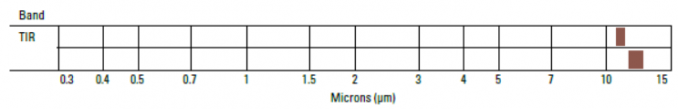
TIRS consists of 2 thermal bands (bands 10 & 11) that measure Earth’s thermal energy. Both bands from TIRS are long-wavelength infrared with 100-meter resolution.
Landsat 8 Band Combinations
As with any image band, you can arrange them in such a way as to extract unique and new information. This is definitely the case by extracting spectral signatures of objects in an image.
In the case of Landsat-8, some of the popular band combinations include natural color, color infrared, and various vegetation indexes.
If you want to view the Landsat-8 band combinations in an interactive web map, then I suggest to you the Landsat Explorer. All you have to do is just switch the rendering of data.
Otherwise, read below for the most common band combinations. Each one uniquely displays different features on the Earth’s surface.
Natural Color (4, 3, 2)
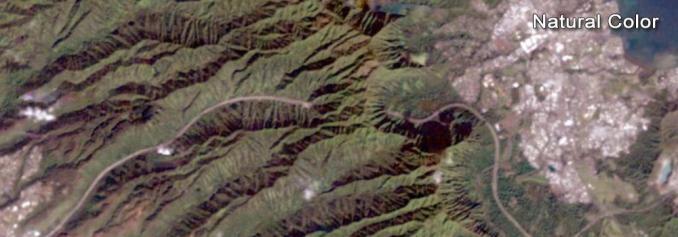
The natural color composite uses a band combination of red (4), green (3), and blue (2). It replicates close to what our human eyes can see. While healthy vegetation is green, unhealthy flora is brown. Urban features appear white and grey and water is dark blue or black.
Color Infrared (5, 4, 3)
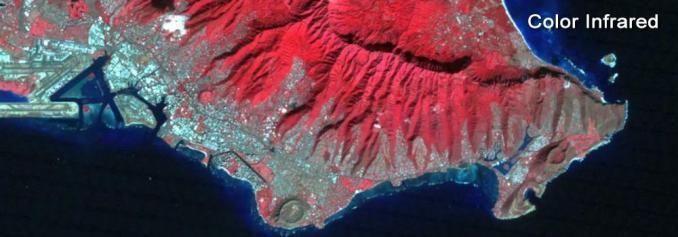
This band combination is also called the near-infrared (NIR) composite. It uses near-infrared (5), red (4), and green (3). Because chlorophyll reflects near-infrared light, this band composition is useful for analyzing vegetation. In particular, areas in red have better vegetation health. Dark areas are water and urban areas are white.
Short-Wave Infrared (7, 6 4)
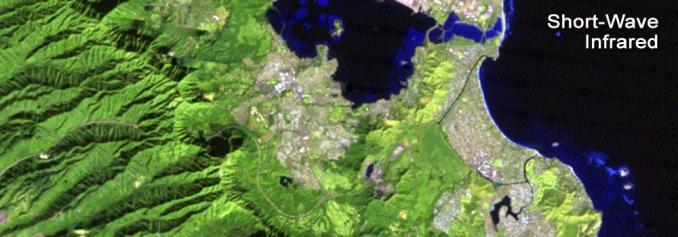
The short-wave infrared band combination uses SWIR-2 (7), SWIR-1 (6), and red (4). This composite displays vegetation in shades of green. While darker shades of green indicate denser vegetation, sparse vegetation has lighter shades. Urban areas are blue and soils have various shades of brown.
Agriculture (6, 5, 2)
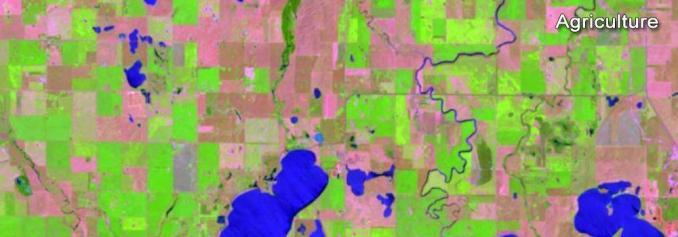
This band combination uses SWIR-1 (6), near-infrared (5), and blue (2). It’s commonly used for crop monitoring because of the use of short-wave and near-infrared. Healthy vegetation appears dark green. But bare earth has a magenta hue.
Geology (7, 6, 2)
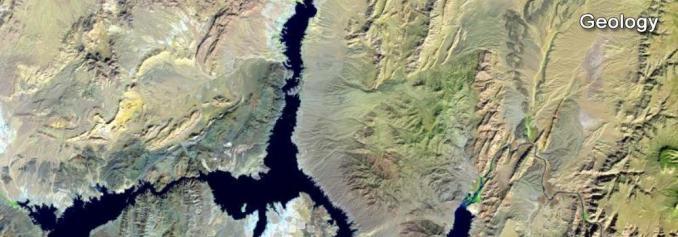
The geology band combination uses SWIR-2 (7), SWIR-1 (6), and blue (2). This band combination is particularly useful for identifying geological formations, lithology features, and faults.
Bathymetric (4, 3, 1)
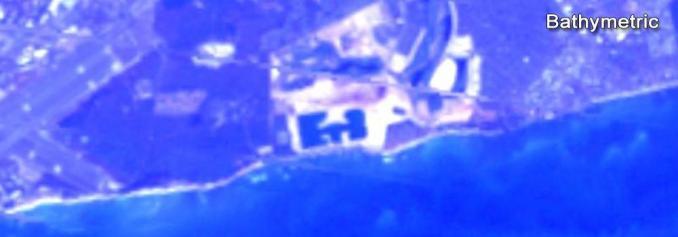
The bathymetric band combination (4,3,1) uses the red (4), green (3), and coastal bands to peak into water. The coastal band is useful in coastal, bathymetric, and aerosol studies because it reflects blues and violets. This band combination is good for estimating suspended sediment in the water.
Panchromatic
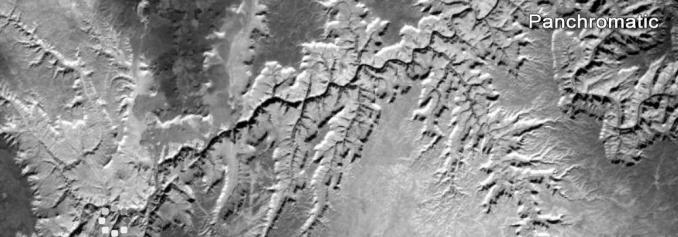
The panchromatic band spans are a longer range of wavelengths and can generate 15m panchromatic images. By pansharpening imagery with the panchromatic band, you can sharpen your imagery producing a crisper product.
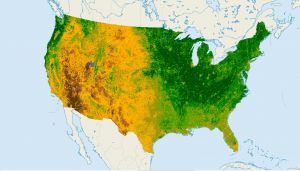
Vegetation Index
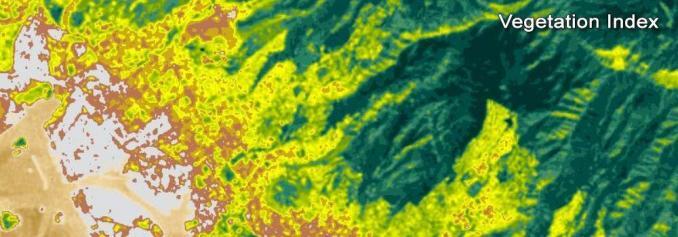
The vegetation index leverages the properties of the red (which vegetation absorbs) and near-infrared bands (which vegetation strongly reflects). As the name implies, we use it to monitor vegetation health and vigor. Normalized Difference Vegetation Index (NDVI) always ranges from -1 to +1. Negative values are indicative of water and moisture. But high NDVI values suggest a dense vegetation canopy.
Moisture Index
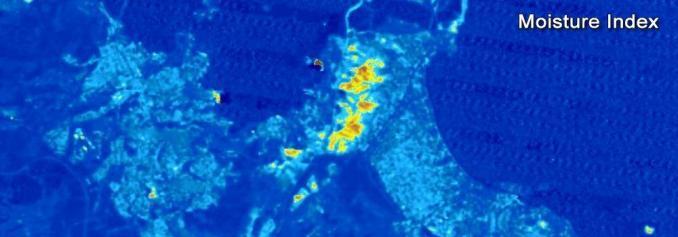
The moisture index estimates the amount of moisture content. Water appears as blue with lighter shades containing less moisture. Finally, bright orange and red have significantly lower moisture content.
Other Key Landsat Details
Landsat-8 was launched on February 11, 2013, and is still active. It started as the Landsat Data Continuity Mission. Now, we know it simply as Landsat-8.
Landsat-8 collects 550 scenes per day. So by August 2020, it will reach a total of 1.5 million collected scenes. This workhorse satellite remains a staple of open source land information for the public.
If you’re interested in learning more, NASA has a great blog post on how to interpret a satellite image.
And of course, the entire Landsat Science website is an excellent resource for keeping up-to-date with everything such as Landsat-9.


Great explanation!
Very detailed explanation
Well explained. Keep it up
Well articulated
For the last three entries, It would be nice if the bands required to get those results were included.
A list of radiometric interpretations for each band would be nice to have. I know that interpretation can vary with brightness/contrast settings, but I’ve seen a similar list elsewhere and it was useful. Just a thought.
The explanation is clear and self explanatory. This is fantastic.
It’s good