Esri JavaScript API Examples: 15 High-Tech Webmaps and Webscenes

What can you do with the Esri Javascript API?
The Esri Javascript API lets you build 2D web maps and 3D web scenes for interactive user experiences.
It allows you to engage with rich information like base map imagery, geoprocessing widgets, integrated mesh layers, and 3D objects.
In this article, we’ll show you 15 high-tech webmaps and webscenes. Each one offers ways to create your own custom applications in a variety of ways.
1. PointCloudLayer (3D LiDAR)
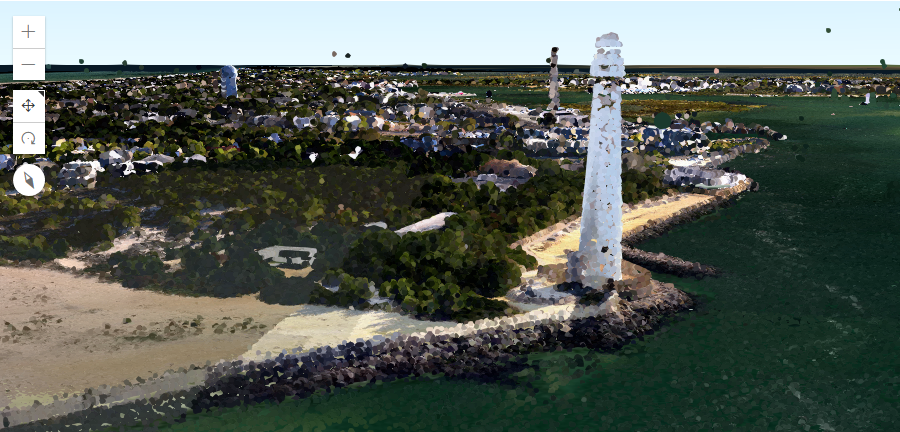
Since ArcGIS API for JavaScript 4.2, point cloud scenes have been given the functionality to quickly display large volumes of symbolized and filtered point clouds.
Just for a ballpark figure for how big a point cloud is: the LiDAR web scene below is more than one billion points. Do you want to create a PointCloud layer?
First, create a LAS dataset layer. Next, you have to generate a scene layer package (.slpk). Finally, you have to publish it as a scene service on Portal or ArcGIS Online.
Imagine the capability to share PointCloud Layers within your organization?
require(["esri/layers/PointCloudLayer"], function(PointCloudLayer))2. Live Web Service & WebGL (Windmill Speed and Orientation)
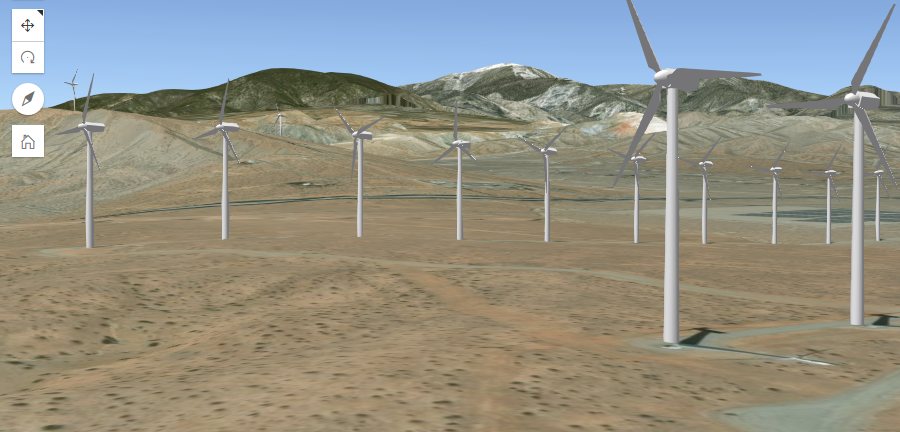
One of the nice things about the Esri JavaScript API is how you can create 3D models in external applications and render them as a built-in layer.
For example, this windmill model was created in Blender with 3D rendering in WebGL.
And the best part?
Depending on the current weather conditions in Palm Springs, the windmill blades’ orientation and speed adjust accordingly. So we have near real-time windmills spinning in sync with a web service. How cool is that?
require(["esri/views/3d/externalRenderers"], function(externalRenderers))3. Integrated Mesh Layer (3D Office Space)
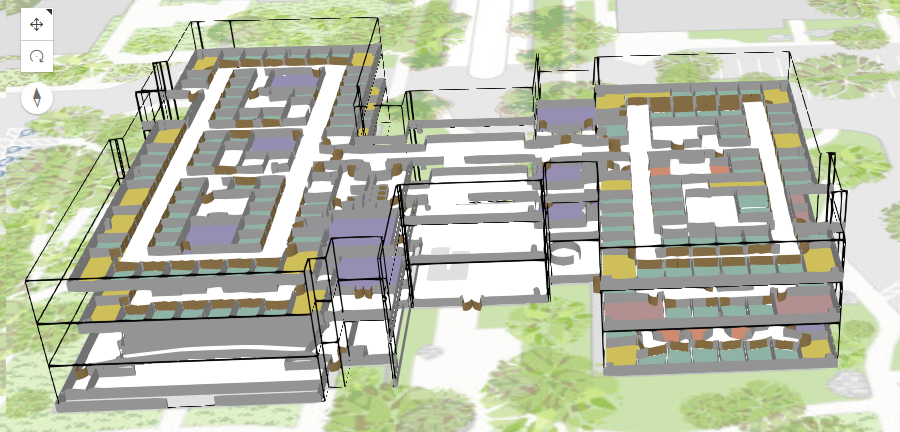
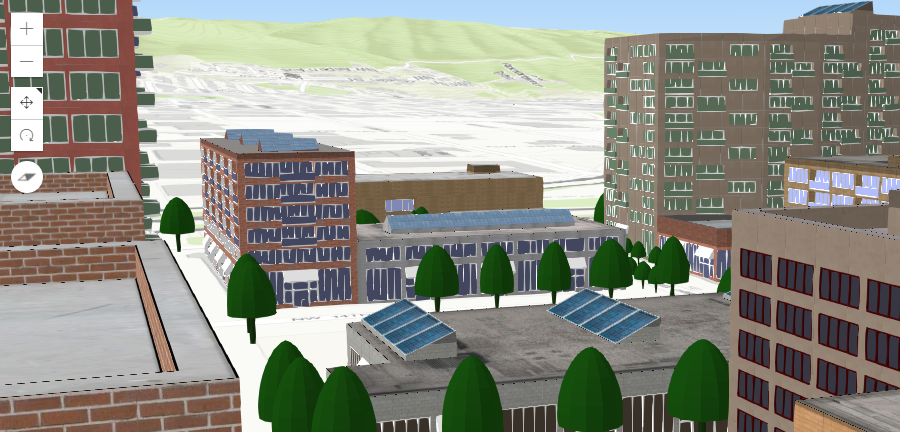
The building wireframe, interior space, walls, and doors are a thing of beauty in this web scene. Each one represents a separate mesh scene layer.
If you want to generate 3D integrated mesh layers of your own, then you can automatically construct them in applications such as Drone2Map.
But what’s best in this web scene is how it uses spatial querying to identify the separate 3D pieces of the building meshes and wireframes.
require(["esri/layers/IntegratedMeshLayer"], function(IntegratedMeshLayer))4. Animate Color Variable (New York Construction)
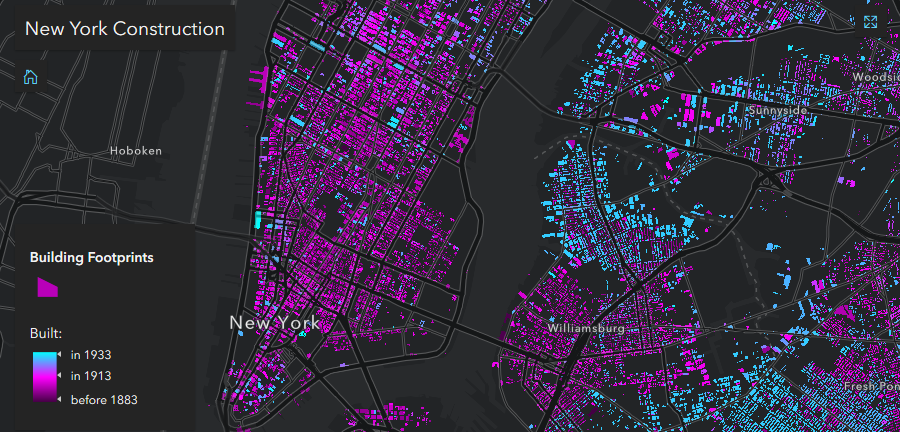
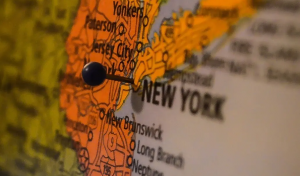
For over 1 million buildings, this webmap animates building construction in New York City since 1934.
As you increase the year of construction, the building footprints change to blue based on the slider year. For all buildings constructed years before, footprints are gradually shaded pink.
Overall, it’s a unique way to visualize the changing landscape of New York before 1934. You can use the Esri JavaScript API to achieve the animated color visual variable in the following manner.
requestAnimationFrame() + HTML slider5. Election Results (Opacity Variable)
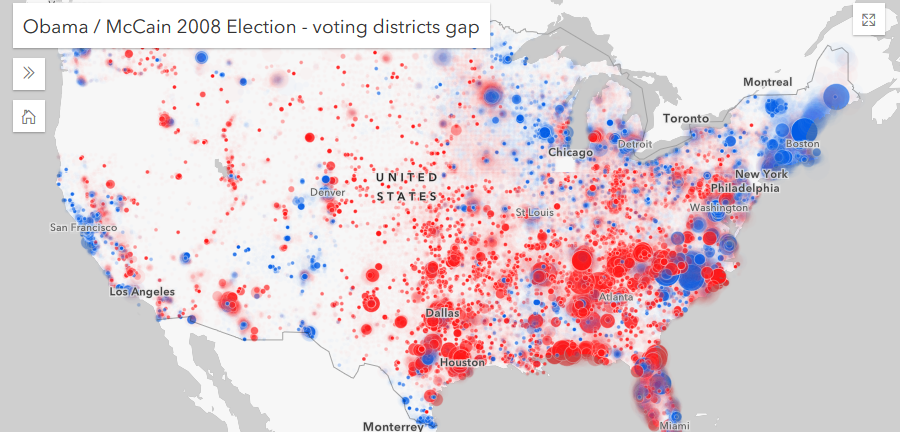
You can add some rich cartographic effects to your web maps using the opacity visual variable. For example, this web map displays the 2008 US presidential election for each voting precinct. While more votes mean larger circles, color represents the candidates.
But what’s special is how the opacity visual variable represents the margin of victory. When the slider is at the “contested” end of the spectrum, circles are opaque and the winner won by a small margin of victory. But when at “landslide”, this represents a large margin of victory.
WebGL renders faster and allows more features than SVG.
require(["esri/layers/FeatureLayer"], function(FeatureLayer))6. Martian Coordinate Systems (Life on Mars)
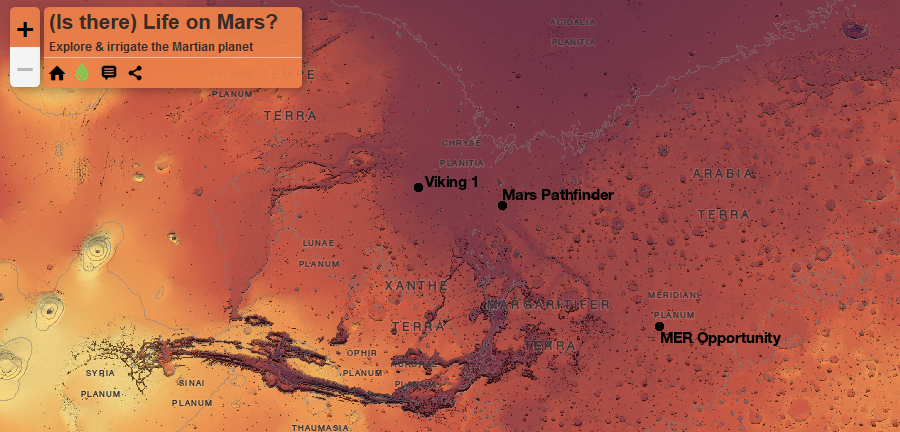
Today’s astronomers want to examine an increasing number of planets and moons dynamically. In the case of Mars, we can irrigate the Martian planet to see how water drains against a proxy reference datum called the Mars areoid.
While the Hellas Impact Crater is the lowest point, the Olympus Mons volcano is the highest peak above the areoid. This web map simulates if you filled water on the Martian planet.
Elevation data is from the Mars Orbiter Laser Altimeter (MOLA) instrument. Interestingly to note, this web map uses the Mars 2000 Equidistant Cylindrical (based on Plate Carrée). Instead of the Web Mercator projection, we can measure distances correctly on Mars.
Projection: Mars 2000 Equidistant Cylindrical (based on Plate Carrée)7. Data Driven 3D Extrusion (Western Pacific Typhoons)

In the typhoon-record-breaking year of 2005, the Western Pacific Typhoon web scene shows 23 typhoons that ripped through the Pacific Ocean at this time.
Like these weather maps, we can interact with this map in interesting ways. For example, we see how wind speed (cylinder scale) relates to barometric pressure (red to yellow color scheme) in each typhoon path.
Typhoons can grow enormously along their path of destruction (in blue). This thematic global scene combines various 2D and 3D data sets to tell the complete story of how far typhoons can travel in the Pacific Ocean.
require(["esri/symbols/ExtrudeSymbol3DLayer"], function(ExtrudeSymbol3DLayer))8. Local Environment (France Live Scene)

Depending on the time of the day, this web scene view reflects the local time in Brest, France. Alternatively, if you want to adjust the clock’s hands, the surrounding environment will change accordingly.
As time passes, day turns to night and the scene view darkens realistically. At night, the position of the stars will align in their proper locations with the Earth. This means that you can gaze at the stars in the comfort of your home as if you were in France. Pretty neat.
Using the Esri JavaScript API environment setting, you can set the lighting and atmosphere parameters. Here’s where you can set the sun’s position to reflect the current time.
view.environment.lighting.date = Date.now();9. Integrated Mesh Layer (Yosemite)
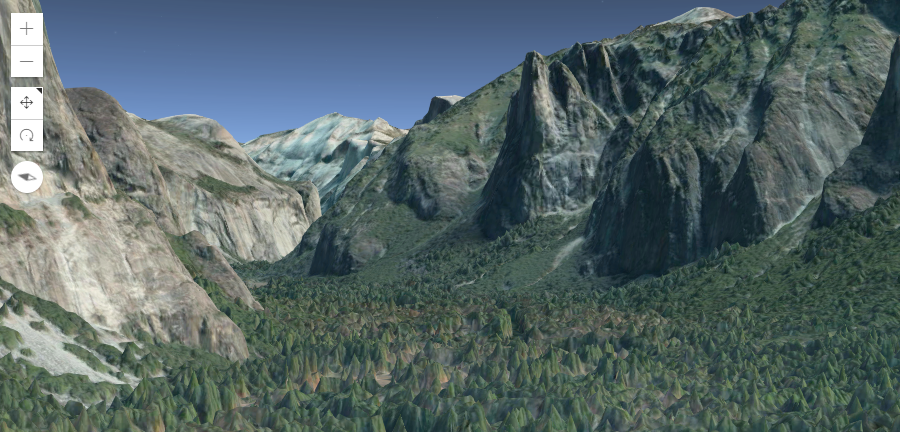
Just to really hit the point home on the beauty of mesh layers…
This integrated mesh layers web scene includes VRICON’s 3D surface model of Yosemite. The realism of the natural and built environment 3D textures is surreal.
It captures all the small details of trees, cliffs, and valleys.
require(["esri/layers/IntegratedMeshLayer"], function(IntegratedMeshLayer))10. Dashboard (New York 3D Animated Crime Rates)
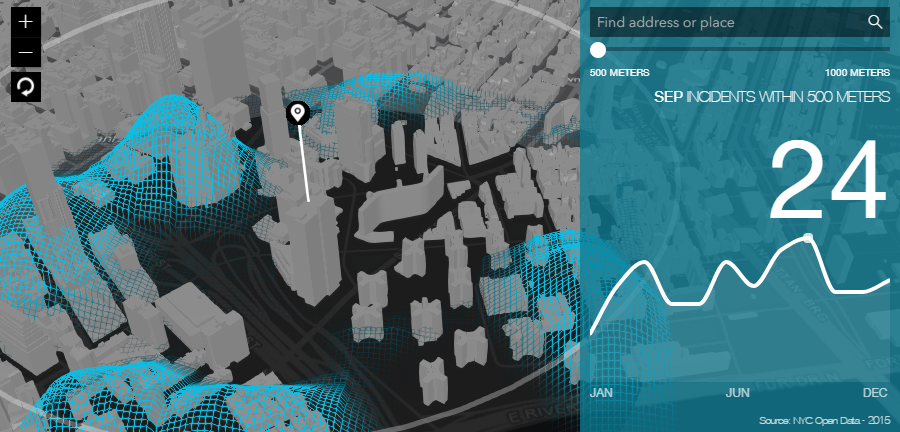
In this NYC dashboard web application, you can interactively buffer locations in New York and find crime trends.
Pick any spot on the map, and watch NYC’s open data crime stats grow and shrink depending on crime locations. On the right side, the dashboard upticks or down-ticks based on the number of crimes.
Instead of a table, this is a neat way to explore crime trends. It’s animated. It’s interactive. And it’s pleasing to the eye.
11. Composite Views

Like having multiple data frames in ArcMap, Esri JavaScript API MapViews is how you can display different locations in a map with different viewports.
For example, if you wanted to show the contiguous 48 states of the United States, you can add them to one viewport. For Alaska and Hawaii, these can go into separate map views.
On top of that, each map view can have its own projection system.
require(["esri/views/MapView"], function(MapView))12. Scene Look Around Camera
As if you are on the rooftop of a building, you can rotate in a fixed camera position. Instead of dragging with a mouse pointer, you can use keys to look up, down, right, and left.
In the Portland web scene, you can use keyboard shortcuts to get a view of all possible directions.
And you can adjust the tilt, position, and heading of the camera. From the camera properties, you can set how these interact in your scene view.
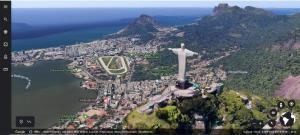
require(["esri/Camera"], function(Camera))13. Geoprocessing Widgets (Viewshed)
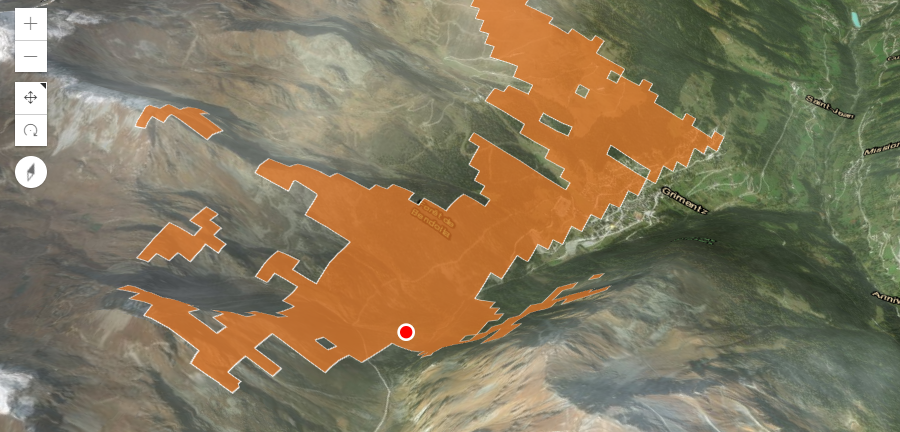
Since the release of the Esri JavaScript API 4, you can perform 3D analysis in your web scenes. That’s right, if you want to perform a viewshed, geodesic buffers, or hot spot analysis, you can do it in a web application.
For example, you can click anywhere in this mountain-filled web scene and see what’s visible from that point in space. And you can simulate viewsheds in multiple locations to really get a feel for how viewsheds work by interacting with the application.
If these types of tools are going to be available in web applications, what does this mean for desktop GIS software?
require(["esri/tasks/Geoprocessor"], function(Geoprocessor))14. Sea Temperature (Custom Elevation Layer)
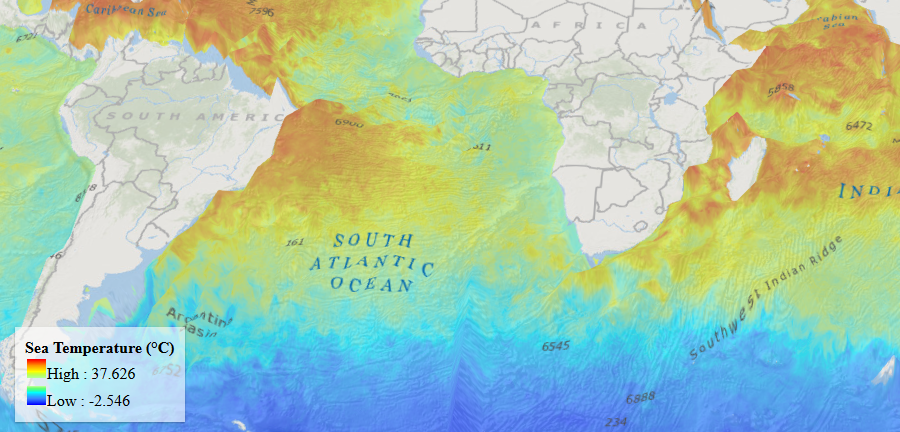
This web scene represents the thematic layer of sea surface temperature using a custom ElevationLayer. If temperatures are above 17°, you can hide it by overlaying a white graphic on top.
You can interact with this map by moving the slider from left to right. For example, you can adjust the slider for various times of the year.
BaseElevationLayer.createSubclass( { /* code goes here */ })15. GeoEnrichment Analysis

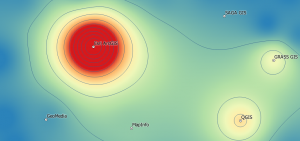
Geoenrichment is how to visualize information about people, places, or locations through charts, tables, and infographics. For example, if you click on this web map, you obtain information about the age groups for neighborhoods in California in an age pyramid infographic.
There are four types of geoenrichment infographics available:
- One Variable shows a single variable
- Related Variables display multiple variables
- Age Pyramid shows an age pyramid
- Lastly, tapestry gives lifestyle information for neighborhoods
require(["esri/dijit/geoenrichment/Infographic"], function(Infographic))The Esri JavaScript API
Every day, the Esri JavaScript API allows us to connect with our community and the place where we’re living in unique and innovative ways.
From Esri JavaScript API 3 which gave us 2D web maps… to Esri JavaScript 4 which now allows us to build interactive 3D web scenes… ArcGIS Online (AGOL) has revolutionized the art of mapping online.
With the Esri Javascript API, we can better inform the public for decision-making and represent priorities from our own spatial knowledge. We can convey and claim our own future giving our own sense of the place that we’re living in.
Now, it’s your turn:
Have you used the Esri JavaScript API? What are some of the features that you use?
READ MORE: 3D Maps: A Complete Guide To See Earth in 3D

More useful to me. Thank you so much for this information