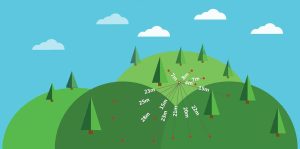
Semi-Variogram: Nugget, Range and Sill
In the case of a semi-variogram, closer things have less variability and are similar. While things farther away are less predictable and are less related.
In the case of a semi-variogram, closer things have less variability and are similar. While things farther away are less predictable and are less related.
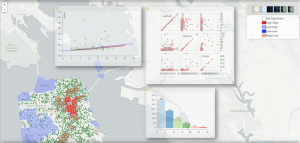
While not necessarily your prototype GIS package, GeoDa carries exciting analytical & visualization tools in industries like economics, health & real estate
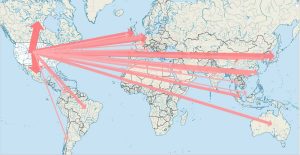
Cartographers use lines to show the movement of phenomenon in flow maps. To show the magnitude, they change the width of flow lines.
Rasterization converts vectors into rasters. While vectorization transforms rasters in vectors. We explain how to go from one data model to the other.