Time in Maps: 10 Types of Temporal Maps
Some maps are timeless. While others, well, they have time in them. This list of 10 ways to show time in maps for temporal maps.
Some maps are timeless. While others, well, they have time in them. This list of 10 ways to show time in maps for temporal maps.
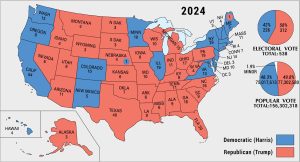
In the 2024 U.S. presidential election, Donald Trump made a historic comeback to the White House by securing around 50% of the popular vote.
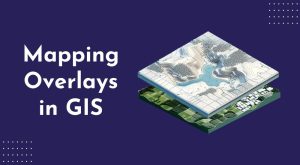
Mapping overlays in GIS work like stacking different layers on top of each other. Each layer represents a different data type.

If you love exploring the globe virtually, these Google Earth alternatives let you see the world from all sorts of different angles.

At the end of every year, we countdown our top 10 pieces of content for what you like most. Here’s what tops the list with our “best of 2024”.
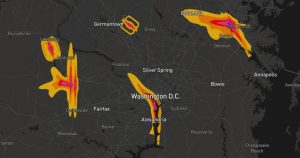
Noise pollution mapping is a way to show how loud different places are. It uses data to make maps that highlight noisy and quiet areas.
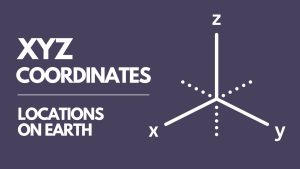
XYZ coordinates represent a point’s location in three-dimensional space. X and Y are its position on the earth’s surface. Z is elevation.
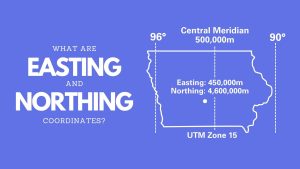
Northing and easting coordinates work together for positioning on maps. They create a grid system on maps, allowing us to pinpoint locations.
A GIS consultant often works based on billable hours. This means they get paid for the time they spend working on a project.
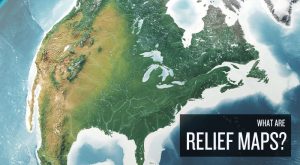
Relief maps are ways to display the Earth’s terrain. It shows the differences in height, like mountains and valleys, using colors and shadows.