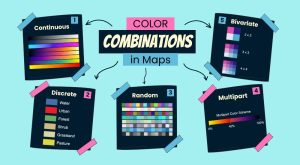
5 Types of Color Combinations for Maps
Color combinations in maps can make a big difference. They help us understand the map better and help readers grasp information quickly.
Color combinations in maps can make a big difference. They help us understand the map better and help readers grasp information quickly.
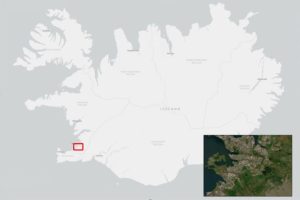
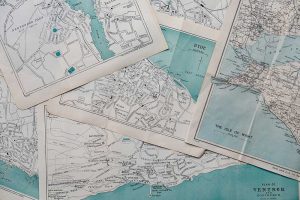
Inset maps (or locator maps) are small maps within a larger one. It shows more details of a part or gives an overview of a specific area.
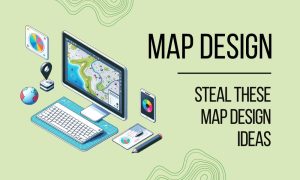
Building maps is both an art and a science. We’re diving into the world of map design. Steal these design ideas to elevate your skills.
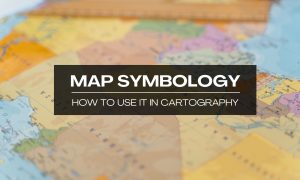
Map symbology is the symbols, colors, lines, and visual elements on a map. These symbols communicate details about the physical world.
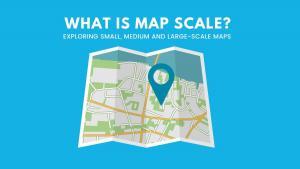
Understanding map scale is important for you as a map user and for anyone who wants to make sense of maps. Learn about this essential concept.
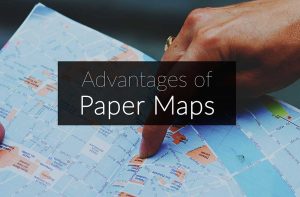
In the digital cartography age, it’s easy to overlook traditional paper maps. But they still serve their purpose in our day in age.
There are several ways to help readers understand map scale and distance. For example, cartographers use scale bars, locator maps, stated and ratio scale.
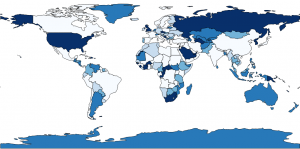
Equal intervals, quantile, natural breaks, pretty breaks- data classification methods generate different choropleth maps. We explain the types of maps here.
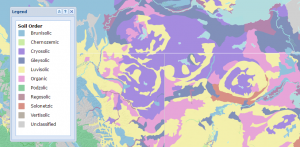
A map legend is used to define features in a map. Point, line and polygon symbols in a legend key is the driving-force to understand what is found in a map.

This guide is like your compass – these 33 mapping tips will guide you in the right direction and show you how to create stunning cartographic maps.