Map Symbology in Cartography
What is the symbology of a map?
Map symbology is the symbols, colors, lines, and visual elements on a map. These symbols communicate details about the physical world. For instance, it could include roads, rivers, or population density. By standardizing these symbols, maps become easier to read and understand.
Types of map symbols in GIS
In GIS, we use map symbology to depict features on a map. We can break vector symbols into points, lines, and polygons. We can have color ramps for continuous and discrete data for raster symbols. Finally, 3D symbols add depth and dimension with their own map symbols.
Below are some examples of map symbols.
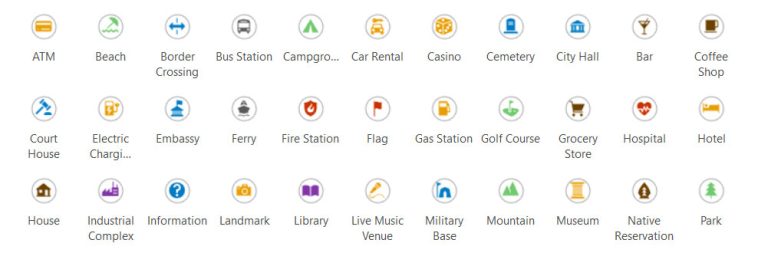
Point symbology
Point symbols mark specific locations on a map using distinct icons or markers. For example, the National Park Service (NPS) symbology has restrooms, campgrounds, and trails. Each can help visitors identify park services and the park’s layout.
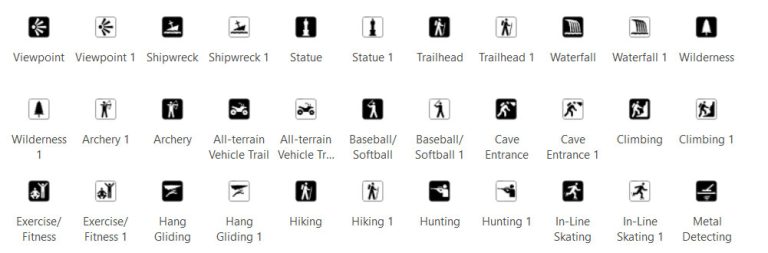
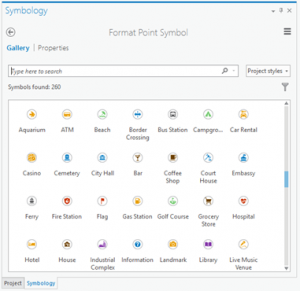
Point symbols in ArcGIS Pro are more generic than the NPS symbols. You can find point symbols like ATMs, beaches, and hospitals. There are also simple graphical markers, such as dots, stars, or custom icons. These symbols in ArcGIS Pro provide flexibility for a broad range of map types.
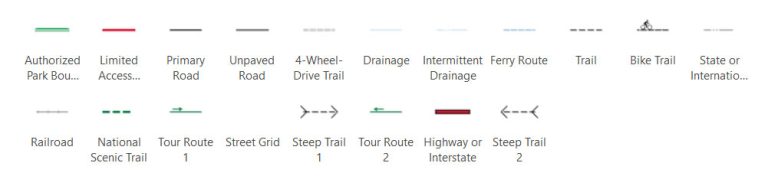
Line symbology
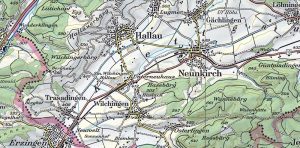
Unlike points, line symbology represents linear features such as roads, rivers, and trails. They can vary in style, width, and color to convey different types of paths or boundaries. For example, you can distinguish between a major highway and a small footpath. By altering their appearance, line symbology can also show the direction of flow such as a river.
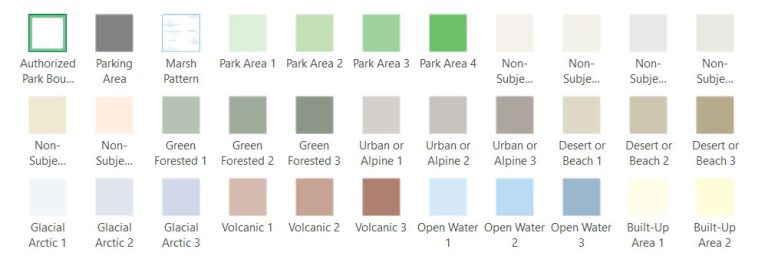
Polygon symbology
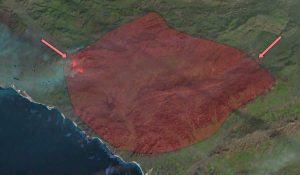
Polygon symbology represents areas by enclosing them within shapes. In the NPS symbology, polygon symbology distinguishes between park boundaries, urban, and water. Thus, polygon symbology differentiates various land and water features within national parks.
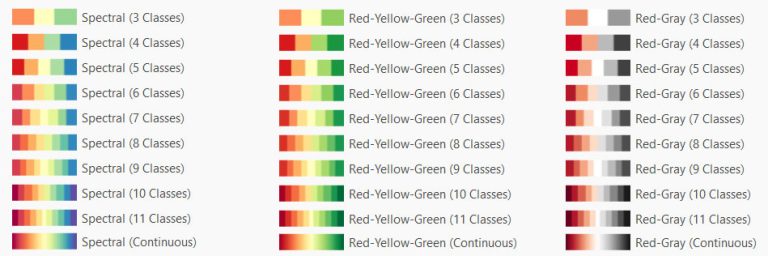
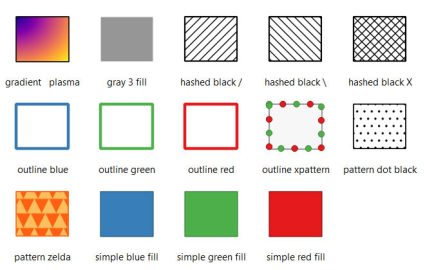
Raster fill symbology
Rasters are an entirely different format than vector data. Instead of vertices, they are grid surfaces. As such, you have raster fills. These can be broken down into continuous and discrete. Discrete raster data represents distinct categories like land cover types. Whereas continuous raster data displays gradual changes across a surface, such as temperature.
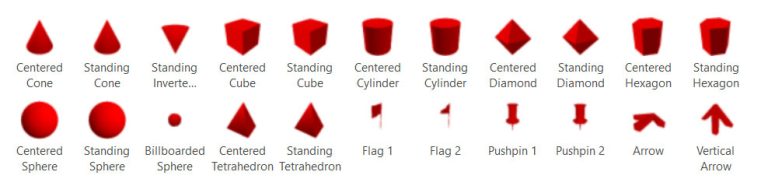
3D symbology
3D mapping adds depth and perspective so it can represent real-world features. Basic 3D point symbols include geometric markers like cones, spheres, and cubes. But there are also 3D models (like buildings) and even 3D fonts. Similar to 2D symbology, you can use 3D line and polygon symbology.
Symbology in GIS
Looking for symbology? Here are some of my favorite sources of symbology that you can download:
1. ColorBrewer
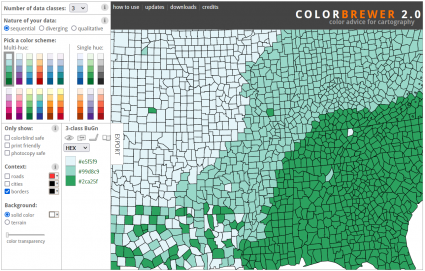
ColorBrewer gives you carefully chosen color schemes. For example, you can choose between “colorblind safe”, “print-friendly”, and “photocopy safe” color palettes.
Cartographers can access the ColorBrewer symbology in both ArcGIS Pro and QGIS. It also has a helpful online tool for you to experiment with a working choropleth map.
2. ArcGIS Pro Styles
Are you looking for symbology in ArcGIS Pro? No need to worry. One place you should check out is the Esri ArcGIS Pro Styles page.
This page has nearly 200 style files (STYLX) you can download. My favorites are the transportation, public safety, and forestry styles.
But this page is like a treasure trove for symbology. And don’t forget that you can search for styles in ArcGIS Online too!
3. QGIS Styles Repository
The QGIS Styles Repository is an online collection of styles and symbols for QGIS. Users can download and apply different visual styles to their spatial data.
Currently, there is a selection of over 160 to choose from. I also suggest sorting by the number of downloads to see what others are using. These are all perfect for making maps in QGIS.
Symbolizing Map Layers
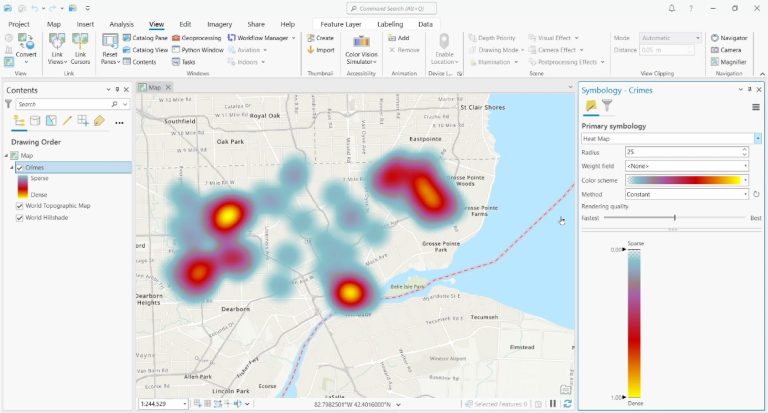
Changing symbols in ArcGIS Pro and QGIS is simply a matter of selecting and replacing them. In ArcGIS Pro, select any symbol in your Table of Contents.
This will open the symbology panel on the right. From here, you just have to select the symbol you want to replace with. Just like this heat map below.
Adding Style Files to your Project
Let’s say you’re unhappy with the selection of symbology available in your project. How would you add new symbols to your project?
To access Style files, you can download one via the Esri ArcGIS Pro Styles page. Next, you can add it to your project through Catalog.
Alternatively, you can go to the Portal tab in Catalog. Next, click the ArcGIS Online button. Finally, search for the “Style” you want to add to your project.
Design and Symbology
Map symbology is about using different symbols and colors to represent real-world things like roads, rivers, and mountains.
These symbols help people understand what they see on a map at a glance. For example, a blue line might show a river, and a red line could be a highway.
By turning complex geography into colorful lines and shapes, map symbology ensures you don’t get lost on your next adventure… unless you’re trying to!