Polar Orbit vs Sun Synchronous Orbit
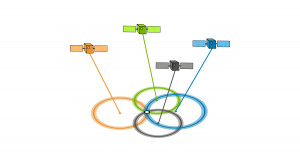
A polar orbit satellite travels pole-to-pole. For a sun-synchronous orbit, it passes over any given point on Earth’s surface at the same local solar time.

A polar orbit satellite travels pole-to-pole. For a sun-synchronous orbit, it passes over any given point on Earth’s surface at the same local solar time.
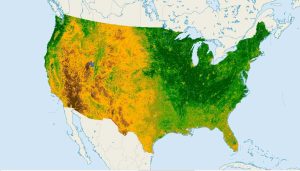
NDVI quantifies vegetation health using near-infrared (which is reflected by vegetation) and red light (which is absorbed by vegetation).

Learn how to georeference with precision in this georeferencing guide. Add control points in two images, select a transformation and check your RMSE.

While Geographic Information Systems answers “what” and “where”, Geographic Information Science (GIScience) is concerned with the “how” and its development.
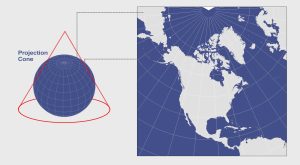
When you place a cone on the Earth and unwrap it, this results in a conic projection. Examples are Albers Equal Area Conic and the Lambert Conformal Conic.
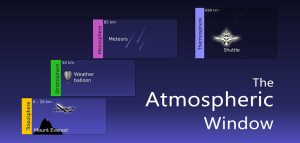
The atmospheric window allows specific bands of electromagnetic (EM) radiation to reach the Earth. On the other hand, absorption bands prevent EM radiation.
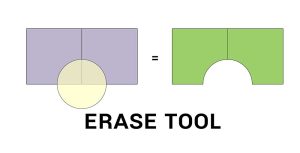
The Erase Tool removes the area that is overlapping with the erasing features. Everything outside the erasing layer ends up in the output.

Esri’s tapestry segmentation data provides insights on lifestyle choices made by customers helping you make more informative business decisions.
Have you ever wondered about your GPS accuracy? A well-designed GPS receiver can achieve a horizontal accuracy of 3 meters or better. But factors affect it.

Tobler’s First Law of Geography states that everything is related to everything else, but near things are more related than distant things.