What is Conflation, Edge Matching and Rubbersheeting?
Conflation is the process of combining and reconciling multiple spatial datasets to create a more accurate and unified representation of geographic features.
How to Perform Conflation
Are you confused with conflation? Confused no more. When you have two conflicting data sets that you want to combine into one, conflation resolves conflicts by preserving the most accurate one.
Still confused? Let’s set things straight with an example. But first, here are definitions of each one:
CONFLATION: Conflation is the process of combining and harmonizing geospatial data from different sources to create a more accurate and comprehensive representation. It involves reconciling differences, resolving inconsistencies, and merging data to produce a unified dataset.
EDGE MATCHING: Edge matching is a cartographic technique that ensures seamless alignment and continuity between adjacent map sheets or datasets. It involves adjusting the borders of adjoining map sections to eliminate gaps, overlaps, or misalignments, creating a cohesive and visually pleasing map.
RUBBERSHEETING: Rubbersheeting, also known as geometric correction or image registration, is a process in cartography and remote sensing. It involves spatially transforming a digital map or image to align with a more accurate reference map or coordinate system. This correction compensates for distortions caused by factors like scale differences, projection variations, or geometric inaccuracies.
Do You Need Conflation for GIS Data?
Certain industries use conflation more than others. To name a few, transportation and construction often have conflicting data sets from different sources.
When you have different authority groups (national, local, and private sector), data is often collected differently. Whether it’s captured at different scales or in the field, it comes down to how the geographic data was collected.
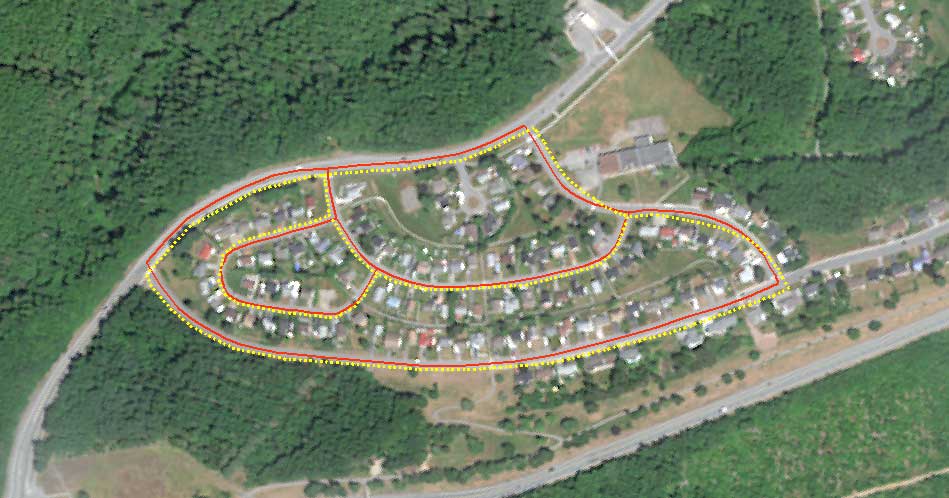
In the two road data sets above, the red polylines have the most accurate geometry. But let’s say that the yellow polylines have more attribute information.
So if you want to transfer attributes from another polyline data set to another, how would you do that?
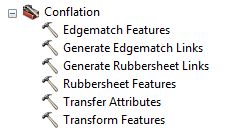
If you want to mix these two road data sets together, then you should use some of the conflation tools. When using ArcGIS, the conflation tools are under the Editing Toolset.
How To Edgematch End Points
When you have two counties with disconnected lines at the borders, you should use the edge matching tools to connect them.
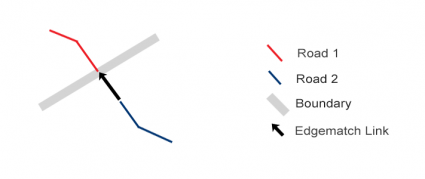
In the case below, there are disconnected lines at the border. This is a case when you’ll need to use some of the conflation tools.
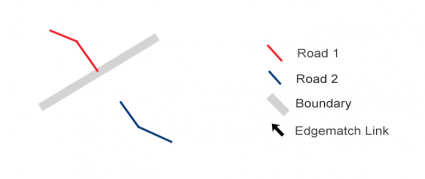
In order to conflate these two data sets, you should use a two-step combo. First, you’ll have to generate edge-match links. Secondly, you’ll actually move those endpoints connecting the two data sets.
In this step, you generate edge match links and see where those connections are made geographically.
PRO TIP: Before you begin the next step, make a copy of the data set you want to conflate.
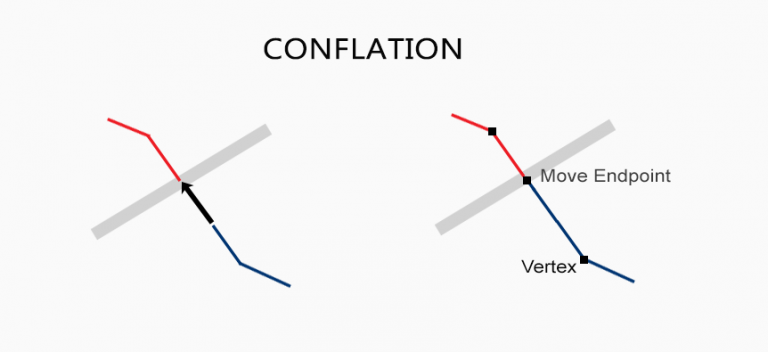
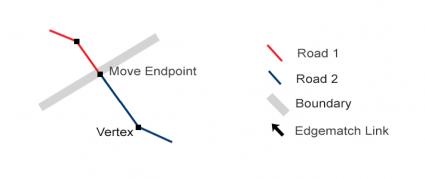
For the data set you want to conflate, you’ll edge-match features by moving each endpoint automatically.
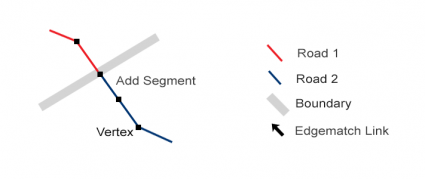
Alternatively, you can choose to edge match features by adding a whole new section and vertex like in the example below.
Finally, you can physically adjust all the vertices and truly conflate data sets.
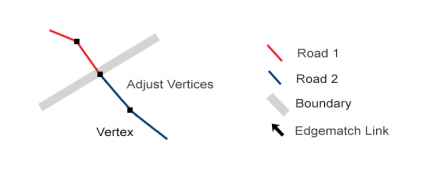
After running the two-step process, we have a fully conflated roads data set. All the endpoints will match along the boundary saving time.
How To Rubbersheet Two Data Sets
While edge matching is good for endpoints, rubber sheeting conflation matches a whole load of vertices.
As you can see in the example below, these two data sets are not aligned.
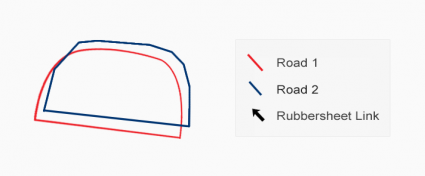
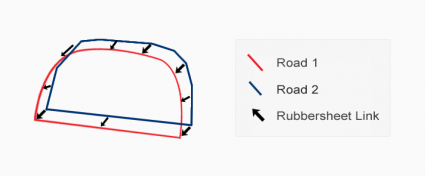
The first step to take is to generate rubber sheeting links as displayed with arrows.
Again, make a copy of the data set you want to conflate.
When you rubber sheet feature, you are physically moving all those vertices from one data set to another. Depending on the rubber sheeting links, you should get similar-looking features using either one of the linear or natural neighbor methods.
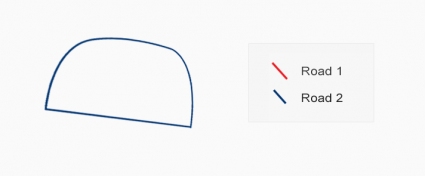
Finally, you can transfer attributes from one data set to the other so you don’t have to re-enter it all again.
What Is Conflation?
We live in a data world. It’s quite common for the repetition of data sources.
While the ideal solution is for everyone to work together from the start, conflation works by resolving conflicts by preserving the most accurate one (in theory, at least!)
The way to avoid conflation is by setting topology rules to fix errors. But conflation is another type of error fixing that fuses two data sets together.
Have you ever done conflation? What works best and worst, let us know with a comment below.


Good Morning,
When and by whom was ‘rubbersheeting’ first introduced?
Thank you
Michael Message