7 Drought Maps for Tracking Water Scarcity
These 7 drought maps enable us to understand the severity and extent of the drought with up-to-date information. They capture key information like water availability so we can proactively plan and combat the effects of drought. Let’s get started.
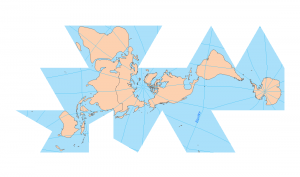
1. Global Drought Information System (GDIS)
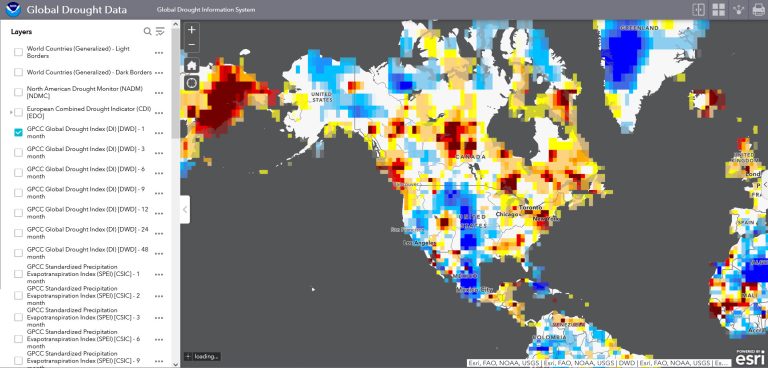
GDIS is an international effort for understanding and tracking global drought patterns. Some of its key benefits include:
- Includes drought datasets – NADM, CDI, SPEI, and SPI
- Contains GPCC Drought Index for periods of 1, 3, 6, 9, 12, 24, and 48 months
- Classifies drought map into wetness and drought categories
- Categories include vegetation stress, soil moisture deficit, rainfall deficit, etc.
- Restores the map extent and layers visibility where you left off
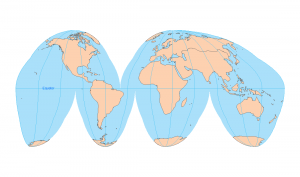
2. Global Drought Observatory (GDO)
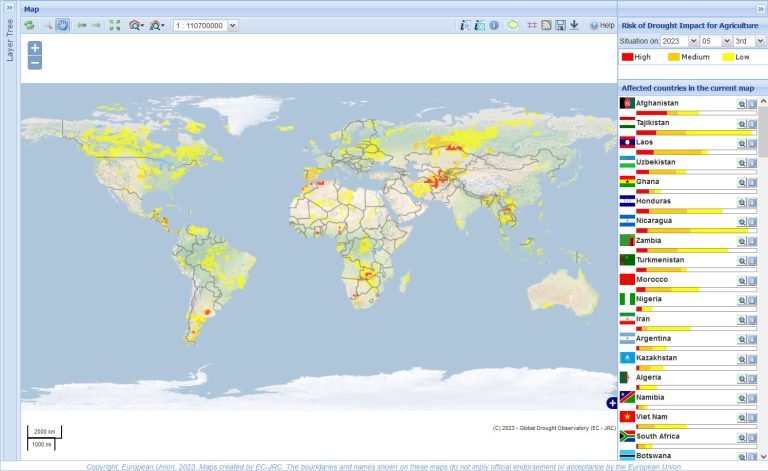
The Global Drought Observatory (GDO) monitors and assesses drought conditions worldwide. The GDO MapViewer displays the “Risk of Drought impact on Agriculture” as high (3), medium (2), low (1), and no risk (0).
- Summarizes affected countries by their risk of drought impact on agriculture
- Add drought forecast layers for unusually dry and wet conditions
- Create maps that change the time period of risk back to 2010
- Turn on ancillary datasets like precipitation, temperature, soil moisture, hydrology, and vegetation response
3. North American Drought Monitor (NADM)
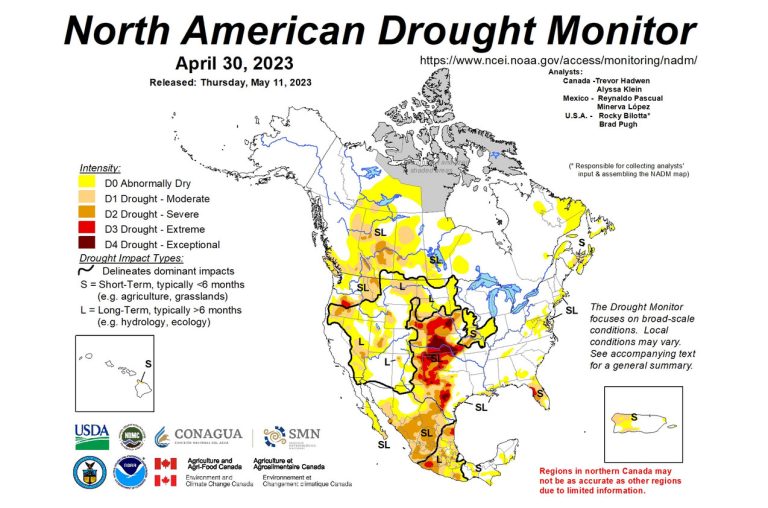
The North American Drought Monitor (NADM) is a continental effort to monitor the effects of drought. This map spans the countries of Canada, the United States, and Mexico with drought conditions.
- Categorizes as Abnormally Dry (D0), Moderate Drought (D1), Severe Drought (D2), Extreme Drought (D3), and Exceptional Drought (D4)
- Provides timely assessments of drought conditions across North America
- Data is available for download in shapefile format
- Plays a crucial role in early warning systems
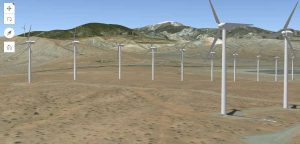
4. Climate Engine
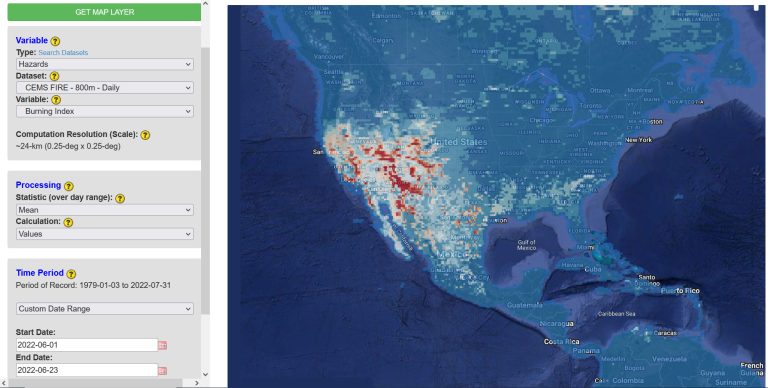
Climate Engine is a web-based platform developed by the Desert Research Institute (DRI) and NASA. It provides access to a wide range of climate and remote sensing data. Users can visualize climate variables, such as temperature, precipitation, vegetation, and drought. You can also find more wildfire maps that are happening in real-time.
- Standardized Precipitation Index (SPI)
- Evaporative Demand Drought Index (EDDI)
- Standardized Precipitation Evapotranspiration Index (SPEI)
- Palmer Drought Severity Index (PDSI)
- Hargreaves Evaporative Demand Drought Index (EDDI)
5. National Integrated Drought Information System
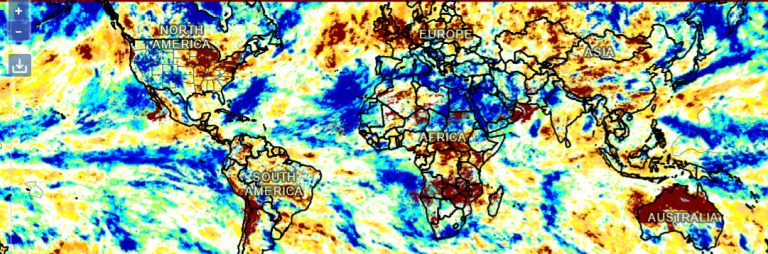
Drought.gov is a website developed by the National Integrated Drought Information System (NIDIS) in the United States. It serves as a centralized hub for accessing drought information, tools, and resources. It also provides data, maps, forecasts, and drought-related research. Its map layers include:
- Standardized Precipitation Index (SPI)
- 1-Month SPI (CMORPH)
- 3-Month SPI (ERA5)
- 9-Month SPI (GPCC)
6. ReliefWeb
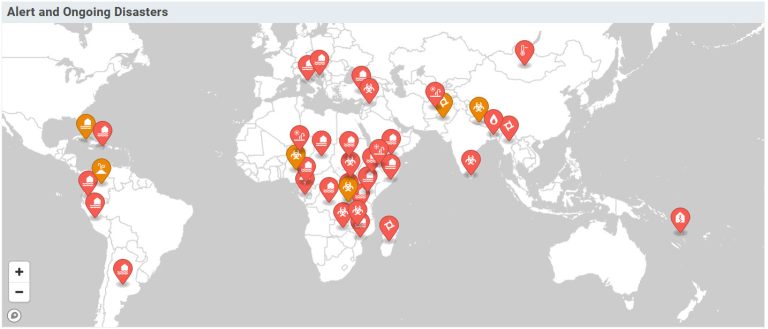
ReliefWeb aims to support humanitarian response and coordination through its disaster alert map. This platform provides timely updates on global crises and disasters including droughts.
- Lists disaster types with the affected country and current status
- Describes the reasoning behind droughts and access to water
- Includes the most pressing humanitarian issues related to the disaster
- Filter out the types of disasters
7. Global Information and Early Warning System on Food and Agriculture
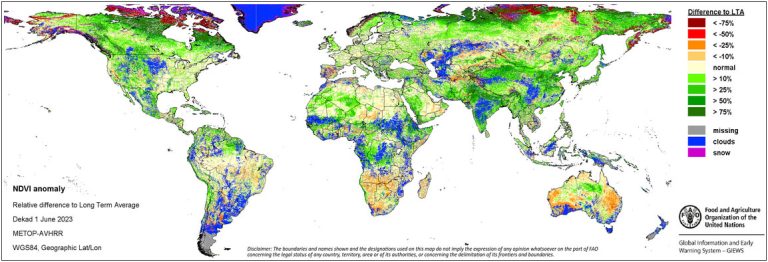
The main goal of GIEWS is to enhance global monitoring and early warning systems for agricultural drought. It aims to strengthen the capacity to track and predict agricultural drought conditions on a global scale.
- Provides precipitation indicators
- Select countries to highlight the spatial distribution of variables
- Includes near real-time (10 days) and monthly summary (30 days)
READ MORE: Agriculture and Global Farming Maps
Tracking Water Scarcity with Drought Maps
The use of drought maps has become an essential tool in monitoring and tracking water scarcity around the world.
These drought maps provide crucial visualizations of severity and spatial distribution.
The purpose is to make informed decisions regarding water resource management and drought mitigation strategies.


Don’t forget the African Flood and Drought Monitor and the country level equivalents in many southern African countries. https://hydrology.soton.ac.uk/apps/afdm/ for the former and https://hydrology.soton.ac.uk/apps/ for the latter.
They are affiliated with UNESCO’s Intergovernmental Hydrological Programme, as is my center (www.iciwarm.info).
Cheers – Will