Landsat Program: 50+ Years Archive of Earth
The Landsat Program: Landsat 1 to Landsat 9
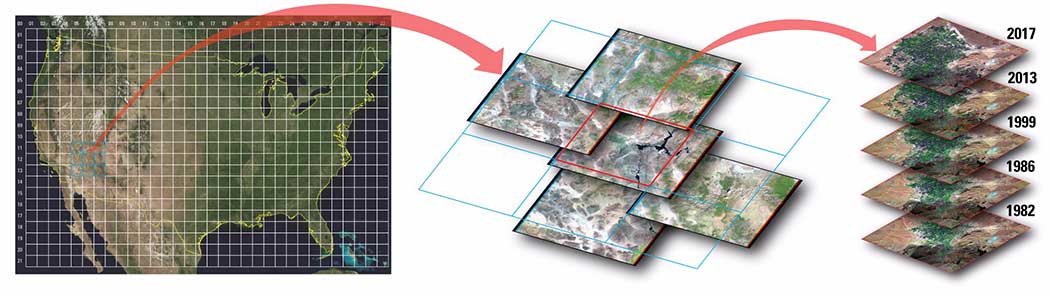
Imagine being able to rewind fifty years for any given place and time.
Then, see how much it’s changed. How much would you pay for that?
Turns out you can turn the clock 50 years back in time through the Landsat Program!
Today, let’s take a close look at the largest archive on Earth. All were collected from Landsat satellites.
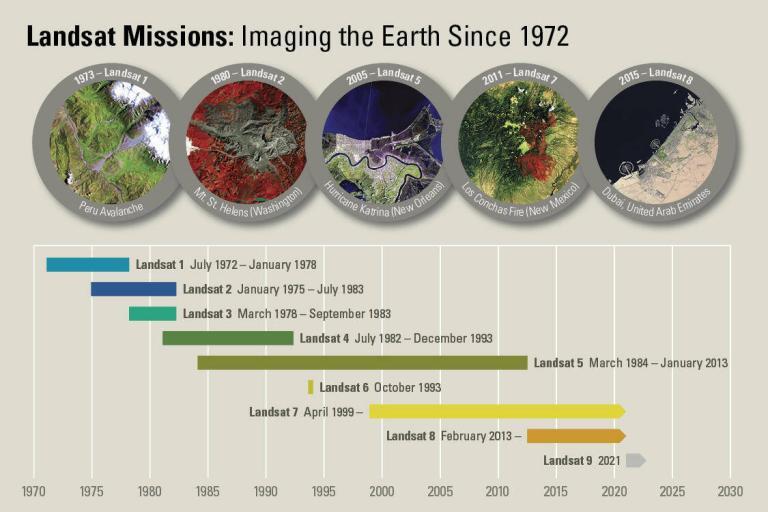
A Timeline of the Landsat Program
There have been 9 Landsat satellites. One of them didn’t make it into orbit. But the other eight satellites did.
Landsat 9 is the most recent mission, which was launched in September 2021.
Landsat’s other name is the Landsat Data Continuity Mission (LDCM). This is because there’s a commitment to ensure the future of Landsat.
From Landsat 1 to 9, all Landsat imagery is openly available through the USGS Earth Explorer. Today, let’s go on a journey of the Landsat program.
Landsat 1
The archive of our planet starts with Landsat 1. Originally, Landsat was named Earth Resources Technology Satellite (ERTS). But we now simply call it Landsat 1. It’s because of Landsat 1, you can rewind time as far back as 1972.
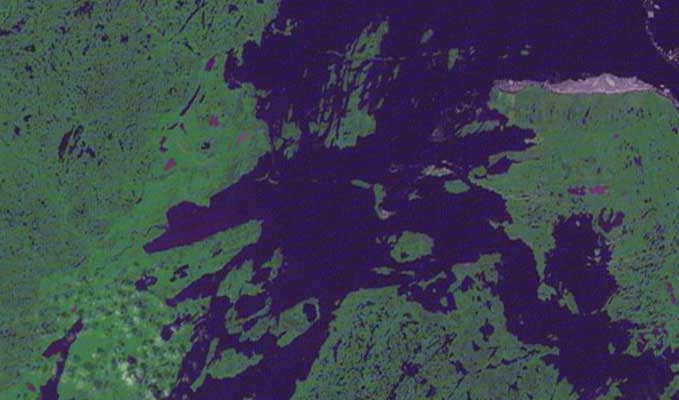
Because of its success, Landsat 1 paved the way for future satellites. In fact, it even discovered an island on the coast of Labrador that we still call Landsat Island.
| Launch Date | July 23, 1972 |
| Deactivation Date | January 6, 1978 |
| Sensor 1 | Return Beam Vidicon (RBV) |
| Sensor 2 | Multispectral Scanner System (MSS) |
| Resolution | 80 m |
| Scene Size | 170 km x 185 km |
| Launch Base | Vandenberg Air Force Base |
Landsat 2
This was the second mission of the Landsat program. It was originally named ERTS-B and launched on January 22, 1975. For a span of 7 years, it collected 240,000 scenes. Then, USGS removed it from the operational status on February 25, 1982.
Landsat 2 was nearly identical to its predecessor. For example, it collected green, red, and two near-infrared bands. Also, the resolution was mostly the same at 80m pixel size.
| Launch Date | January 22, 1975 |
| Deactivation Date | February 25, 1982 |
| Sensor 1 | Return Beam Vidicon (RBV) |
| Sensor 2 | Multispectral Scanner System (MSS) |
| Resolution | 40m, 80m |
| Scene Size | 170 km x 185 km |
| Launch Base | Vandenberg Air Force Base |
Landsat 3
The goal for Landsat 3 was to continue archiving the planet without any gaps in time. As Landsat 3 was in service for over 5 years, it was able to collect 140,000 scenes.
Landsat 3 had similar specs to past satellites. For example, it collected green, red, and two near-infrared bands. But it also had a thermal band, which failed shortly after launch.
| Launch Date | March 5, 1978 |
| Deactivation Date | March 31, 1983 |
| Sensor 1 | Return Beam Vidicon (RBV) |
| Sensor 2 | Multispectral Scanner System (MSS) |
| Resolution | 40m, 80m |
| Scene Size | 170 km x 185 km |
| Launch Base | Vandenberg Air Force Base |
Landsat 4
This is the fourth mission of the Landsat program. By collecting 217,650 total scenes, it continued its long-running archive. But Landsat 4 was different because USGS introduced a brand new sensor.
Landsat 4 was the first satellite to equip the Thematic Mapper (TM). Instead of 4 bands like before, Landsat 4 gathered 7 in total. Also, ground resolution sharpened substantially to 30 m pixel size. But the thermal band had 120 m resolution.
| Launch Date | July 16, 1982 |
| Deactivation Date | December 14, 1993 |
| Sensor 1 | Thematic Mapper (TM) |
| Sensor 2 | Multispectral Scanner System (MSS) |
| Resolution | 30m, 120m |
| Bands | Blue, Green, Red, NIR1, NIR2, MIR, Thermal |
| Launch Base | Vandenberg Air Force Base |
Landsat 5
Despite a 3-year design life, Landsat 5 operated for nearly 29 years. Because of its durability, it’s recognized in the Guinness World Record for the longest-operating earth observation satellite in history.
Landsat 5 collected imagery for major events including Chornobyl, devastating tsunamis, and deforestation. Because it also had the Thematic Mapper, Landsat 5 images are consistent with its immediate predecessor.
| Launch Date | March 1, 1984 |
| Deactivation Date | June 5, 2013 |
| Sensor 1 | Thematic Mapper (TM) |
| Sensor 2 | Multispectral Scanner System (MSS) |
| Resolution | 30m, 120m |
| Bands | Blue, Green, Red, NIR1, NIR2, MIR, Thermal |
| Launch Base | Vandenberg Air Force Base |
Landsat 6
Unfortunately, Landsat 6 was the only satellite in the Landsat program that failed to reach orbit. NOAA attributes a ruptured manifold as the main reason for failure. This rupture prevented fuel from reaching the satellites stabilizing engines.
Landsat 6 was supposed to have an upgraded Thematic Mapper. The Enhanced Thematic Mapper (ETM) would collect 15 m panchromatic images. But the other 7 spectral bands would remain 30 meters ground resolution.
Landsat 7
This is the 7th satellite of the Landsat program. It was the first to reach orbit with the Enhanced Thematic Mapper (ETM+) instrument which added a 15 m panchromatic band.
In May 2003, Landsat 7 endured a mechanical failure in the Scan Line Corrector (SLC). Since then, Landsat 7 images have resulted in partially missing data because of the SLC failure.
| Launch Date | April 15, 1999 |
| Status | Remains in orbit |
| Sensor | Enhanced Thematic Mapper (ETM+) |
| Resolution | 15m, 30m and 60m |
| Bands | Blue, Green, Red, NIR-1, SWIR-1, SWIR-2, Thermal, Panchromatic |
| Launch Base | Vandenberg Air Force Base |
Landsat 8
This satellite has two instruments combining for 11 total spectral bands. Seven of the eleven spectral bands are basically consistent with ETM+ found on Landsat 7.
Landsat 8 bands include coastal, blue, green, red, NIR, SWIR-1, SWIR-2, and cirrus bands at 30m resolution. While the panchromatic band has a 15m resolution, TIRS is 100m pixel size.
| Launch Date | February 11, 2013 |
| Status | Remains in orbit |
| Sensor 1 | Operational Land Imager (OLI) |
| Sensor 2 | Thermal Infrared Sensor (TIRS) |
| Resolution | 15m, 30m and 100m |
| Bands | Coastal, Blue, Green, Red, NIR1, SWIR-1, SWIR-2, Cirrus, Panchromatic, TIR-1, TIR-2 |
| Launch Base | Vandenberg Air Force Base |
Landsat 9
Landsat 9 was successfully fast-tracked and launched in September 2021 from Vandenberg Space Force Base in California. This satellite fully replaces the faulty Landsat 7, extending the lifeline of the Landsat program.
Landsat 9 is almost a duplication of the design of Landsat 8 with the exception of the thermal sensor, which will be upgraded to TIRS-2. These two optical sensors will detect 11 total spectral bands of visible, near-infrared, shortwave infrared, and thermal infrared light.
| Launch Date | September, 2021 |
| Sensor 1 | Operational Land Imager 2 (OLI-2) |
| Sensor 2 | Thermal Infrared Sensor 2 (TIRS-2) |
| Resolution | 15m, 30m and 100m |
| Bands | Coastal, Blue, Green, Red, NIR1, SWIR-1, SWIR-2, Cirrus, Panchromatic, TIR-1, TIR-2 |
| Launch Base | Vandenberg Air Force Base |
Applications
Here are some use cases and applications where Landsat imagery is put into use to its full potential. It spans various different industries ranging from agriculture to the environment.
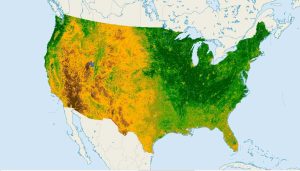
Agriculture

From monitoring the food supply chain to doing detective work for fraudulent crop insurance claims, NASA keeps a watchful eye on our planet. Healthy vegetation reflects green and near-infrared light but absorbs red and blue light.
By using the Normalized Difference Vegetation Index (NDVI) from Landsat, we can monitor chlorophyll created by plants during photosynthesis. This gives us a big picture for quantifying crop conditions in agriculture.
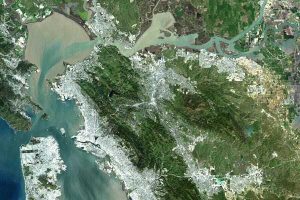
Environment

The Landsat Program is the longest-running Earth observation mission in our history. Its digital records date back to the 1970s. If we want to understand our changing landscape, the Landsat missions give us a snapshot back in time. It helps learn from the past for future generations.
Everything from oil spills, deforestation, and urban development – Landsat has seen it all. For example, Landsat Explorer shows everything from change detection to the various band combinations.
Forestry
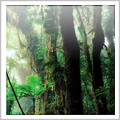
Billions of people rely on forests for their livelihood. But deforestation is occurring at a high rate putting the lives of people in jeopardy. Landsat continuously monitors illegal rainforest cutting from mining, agriculture, and logging companies.
It’s not only deforestation, but Landsat assesses disease, wildfires, and forest degradation. Each of these can have catastrophic effects on ecosystem health and local economies.
Water resources

For water, it’s all about keeping it clean and absent of harmful nutrients. It turns out you can learn a lot about a lake’s health through satellite imagery.
For example, Landsat studies algae which is an indicator of the amount of nitrogen and phosphorous being fed into the lake. Also, satellites can delineate the search for oil spills and identify the direction and rate of movement.
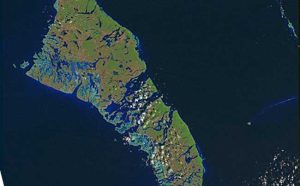
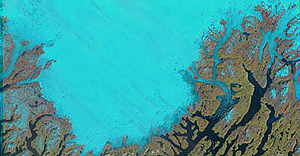
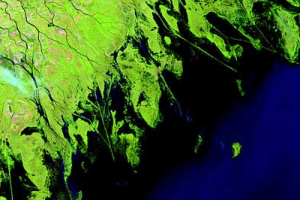
Earth As Art

Some of the most breathtaking views are from space. Evidence of this is in NASA’s 75-page collection of Earth images (NASA’s Earth as Art) seen from space.
The collection of Earth observation images was taken from the Terra, Landsat, EO-1, and Aqua satellites. In this Earth art masterpiece, you can find some of the most intriguing patterns and geometry of our oceans, atmosphere, and land features.
READ MORE: 100 Remote Sensing Applications & Uses
The Incredible Landsat Program
From Landsat-1 to 9, the Landsat program is the greatest archive on our planet
It’s a collaborative effort between NASA and USGS.
NASA is generally responsible for the launch.
Then, the US Geological Survey (USGS) is in charge of operating, receiving, and archiving the data.
References
- Landsat Explorer: Unlocking the Earth
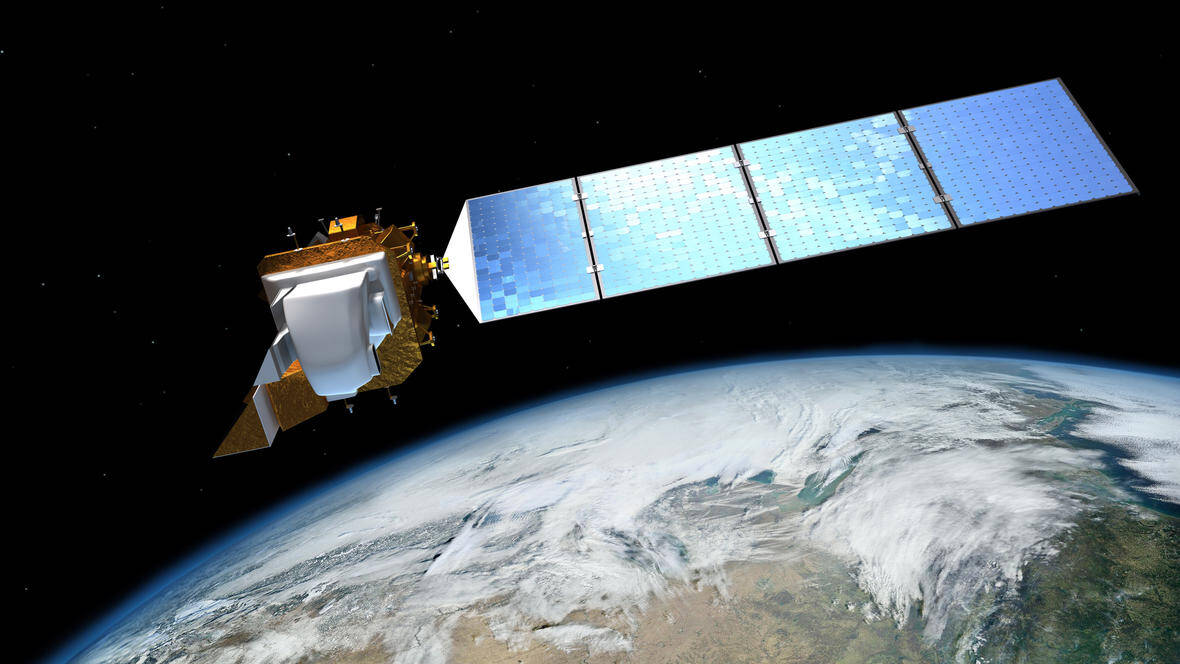
- Credit: United States Geological Survey (Landsat-8 Illustration Above Earth)


Dear sir please try to assist me to download my research area, satellite prefered landsat 8/9
Here’s the best way to download Landsat imagery – https://gisgeography.com/usgs-earth-explorer-download-free-landsat-imagery/
Great stuff, very helpful!
Hello. Many thanks for your very interesting and useful post. I have just one basic question. Why does Landsat CDR not appear as possible choices in the list on Earth Explorer?
Thanks in advance