USGS Earth Explorer: Download Free Landsat Imagery
How to download free Landsat imagery with USGS Earth Explorer?
The USGS Earth Explorer gives some extra capabilities:
- Downloading data over chronological timelines.
- Specifying a wide range of criteria for searches.
- Choosing from a long list of satellite and aerial imagery.
Explore one of the largest databases of remote sensing satellites. But first, follow this guide on how to download free Landsat imagery from the USGS Earth Explorer.
User Interface
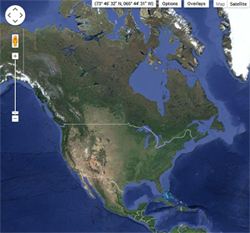
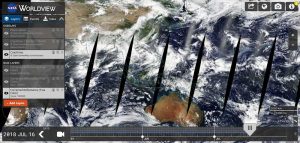
The USGS Earth Explorer interface uses Google Maps. You can zoom in and out with the mouse wheel as if you are in Google Maps. Google Street View is also enabled, where you can drop a marker and get a real view of the location.
First, you’ll have to create an account with USGS. In the top-right corner, click the Register button. As it’s a pretty painless process, you’ll receive instructions to activate your account.
In order to download data from USGS Earth Explorer, here are the four steps you’ll need to follow:
- Set your search criteria
- Select your data to download
- Filter out your data
- Check your results and download
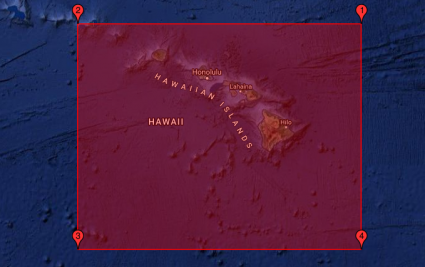
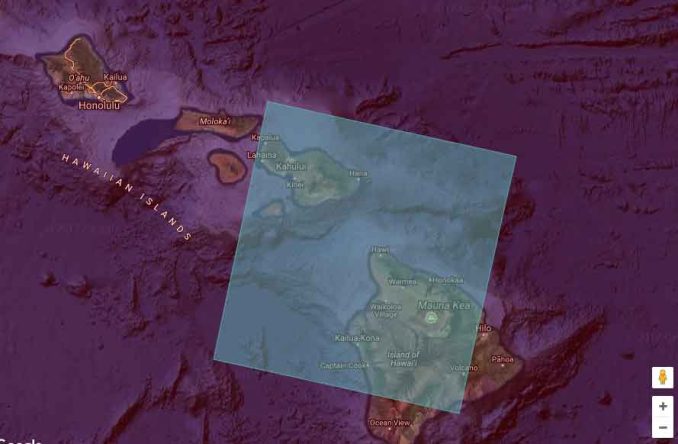
Step 1. Set your area of interest in the “Search Criteria” tab
Users can double-click the browser to create regions of interest. The region of interest (ROI) is the geographic boundary that limits the search to acquire data.
Pro Tip: The easiest thing to do is just to zoom into your area of interest. If you want to download free Landsat imagery for Hawaii, zoom into that area. Now, select the Use Map button. Immediately after, zoom out a bit and you can see that you now have an area of interest on your map.
Alternatively, you can use one of these options to create a region of interest:
- Using an address to search
- Importing a shapefile (in a zip file) or KML
- Or you can just double-click the map to make your ROI
You can also set a timeline for aerial and satellite imagery downloads in USGS Earth Explorer. You no longer need to search through a long list of acquisitions to find the correct date. This is a powerful tool that narrows down your search and saves you time.
Step 2. Select your data to download in the “Data Sets” tab
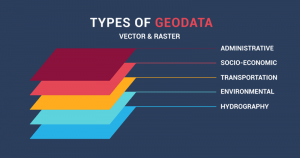
The Datasets tab answers the question: What satellite or aerial imagery are you looking for? The USGS Earth Explorer remote sensing datasets are plentiful: aerial imagery, AVHRR, commercial imagery, DEM, Landsat, LiDAR, MODIS, Radar, and more.
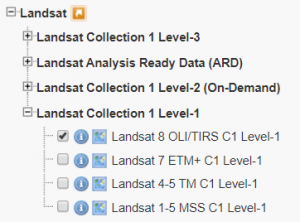
It depends on the date and time for which Landsat scene you can download. In the Landsat > Landsat Collection 1 – Level 1 group, the most recent Landsat imagery is L8 OLI/TIRS and L7 ETM+.
The differences between the collections are based on data quality and level of processing. USGS has classified images into tiers based on quality and processing level.
Now that we’ve identified our area of interest in Hawaii in Step 1, you can select a checkbox in the Landsat Archive category. On-demand means that you will be notified by email where you can download surface reflectance products from a separate interface for processing and data delivery.
Step 3. Filter your data in the “Additional Criteria” tab
90% of people go into the Additional Criteria tab to easily filter out scenes with too much cloud cover. Now, you won’t be able to filter to get the perfect cloudless image everyone wants. But you can set the cloud level to less than 10%, and this is what most people want… unless you’re into meteorological studies.
Here’s a brief explanation of what each set of criteria does:
- Set the Landsat scene identifiers which is a unique way of naming convention and includes the WRS path and row within it
- Filter the temporal condition of the scene as a day/night acquisition or nadir/off-nadir
- Specific the quality of the scene with Level-1 (L1) data products being the best available processing level. The Processing Software Version is what was used to generate that L1 product.
For the average user, you won’t need to set a lot of criteria. Other than cloud cover, you can move on to downloading your satellite imagery.
Step 4. Download free Landsat imagery in the “Results” tab
Now that you’ve defined the date range, type of data, and additional criteria, the search results tab will populate with data sets that match your query.
In the Results tab, you select the specific imagery you want to download. But it’s good to check the footprint for exactly where that scene is located. You can also preview the data, which can be good to see exactly where clouds are in the image.
Download the data by clicking the “Download” button. If you are going to perform an analysis on the Landsat data, the Level 1 GeoTIFF data product is probably the one you’re after, which will be the largest file size.
USGS Earth Explorer Summary
The USGS Earth Explorer gives a quick and intuitive way to download free aerial and satellite imagery. This tool gives a wide range of options. You can define the time period, geographic extent, and imagery type. Test it out for free downloads of remote sensing imagery and more.
Steps to Download USGS Earth Explorer Data:
- Set region of interest and time period
- Specify the type of data you want
- Filter out the data that you don’t want
- Search data sets and download.
A big part of the USGS Earth Explorer is the data available from the Landsat mission. We tell you exactly what are the spectral bands, spatial resolution, and temporal information for its incredible 50+ year history.
READ MORE: Landsat Program: Satellite Imagery Data and Bands
Additional Resources
Well, you downloaded the satellite data for some reason, right? What can you do with satellite imagery once you have it?
Satellite data like Landsat is made up of several spectral bands. These bands have combined to create a true color composite or false-color composite. We have a guide to combine spectral Bands with the ArcGIS Composite Bands Tool.
Need to classify the imagery? You can use supervised, unsupervised, and object-based image analysis. Don’t know the difference between them? No problem. Try out our image classification techniques in remote sensing.
The USGS Earth Explorer is a similar tool to the USGS Global Visualization Viewer (GloVis) in that users search catalogs of satellite and aerial imagery. The USGS Earth Explorer is the new and improved version. If you want more satellite data, this list of 15 free satellite imagery sources should quench your thirst.
On a side note, USGS Earth Explorer now warehouses Sentinel-2 data. So, it’s just not for Landsat imagery because Sentinel-2 is really your best option with its crisp 10-meter continuous coverage of the planet.


My interest is to create ndvi indices from satellite data to create quality indices that can help classify and grade farm output. How can I go about this?
We have two pages that can help you with this –
https://gisgeography.com/ndvi-normalized-difference-vegetation-index/
https://gisgeography.com/how-to-ndvi-maps-arcgis/
I want to download Landsat data but when I click on Landsat… I didn’t find Collection 1 Level 1? Can anyone help me? Thanks
I am a PhD student and currently doing my research to detect forest cover change and hence want to download land use land cover data from USGS Earth Explorer. I tried to register on the USGS many times, but it shows me the following message again and again through each of my trial.
“An error occurred
An error occurred during execution; please try again later”.
So, if there is another option to register let you help me please.
Sorry, but I’ve never seen this error before.
I am student of MS. I’ve tried to download forest data but data covers wider area forest is just like a dot there. if you have any idea to download a specific part of land . Please help me
It’s hard for me to know if the data you downloaded is a larger extent… or if you are missing data. Here are my answers to both questions:
1) If the data that you downloaded covers a wider area. Then, you’ll have to clip it using a “raster clip” tool. This is available in open source QGIS.
2) If you are missing data, then likely you haven’t downloaded all the tiles that you need. What I usually do is I zoom into my area of interest. And then I choose the “Use Map” option. After this zoom out, you’ll see that it selects the entire rectangle area of your screen. Once you get to the “Results” step, make sure that you download all the tiles. This way, you won’t have any missing data.
Hope this helps!
After several trying to download digital elevation model-DEM I was unable. I don’t know why. I even go to Result but it keep on showing me no results found. Please help me
The time range may not be accurate, try the period 1990-2020
I’m trying to use SRTM-1 data to create a topographical map in a CNC machine but I’m having difficulties getting BigTopo to read the files. Am i downloading the wrong data from EarthExplorer?
Is there any way to add all data at one time to the bulk download? I need the SRTM data worldwide and don’t want to go through all 1428 pages in the results and add that data to the bulk download.
How can I download it?
You’ll have to create a free account with the USGS Earth Explorer through the EROS registration system.
I need to have data of images in order to make environmental studies in Lebanon.
I want to download Landsat imagery
Thanks a lot.
Are all Landsat data georeferenced for all time?
Yes, you are able to obtain georeferenced Landsat scenes since its launch.
For several days I tried downloading Landsat imagery L4-5 for the years 1990-1993 but after following all the steps, I cannot get the results I need. The results never included the months of June -September which I need for my research. Pls, any help?
Je veux télécharger les données à fin de réaliser mon projet.
I would like to access hyperspectral image data
Go into the “EO-1” tab. Then, select “EO-1 Hyperion”. This is how you can access hyperspectral imagery.
I am looking for an aerial image of a home from 2008 in Everett Washington, USA. Do your images go back that far and would I be able to see if the yard is fenced?
Yes, Landsat imagery would go that far back. But you wouldn’t be able to tell if it’s fenced.
You can try out some of these historical imagery viewers – https://gisgeography.com/free-historical-imagery-viewers/
I want to download satellite images by using the Earth Explorer
Are contours and spot heights obtained from topo sheets of more than 50 years be useful today, in designing an effective water supply distribution network in urban centers in tropical counties like Nigeria, considering the degradational and aggradational activities that have taken place over the years?
Best and wise note has forwarded. Here, I want to forward three question:
(1) Are all the satellite images geo-referenced? if not, how can we georeference them?
(2) How can we extract the boundary of the specific area from the satellite images, example, boundary of water shades and river basins?
(3) It is said that RGB composites can be used as a base map. What is also the base map used for?
(1) Yes, images are georeferenced
(2) You use image classification to extract boundaries of features in an image. https://gisgeography.com/image-classification-techniques-remote-sensing/
(3) RGB composites are how we naturally see features in an image. Therefore, it’s good for extracting land cover classes like vegetation, urban, water, wetlands, agriculture and and land use information
Thank you very much for this excellent entry, and for the entire site. It has been such a valuable resource for me, given that I don’t have formal training in the GIS analysis area.
As such, I have a newbie type of question: In the Download options, aside from the .tiff files, there are other options such as “Full Resolution Browse Bundle”, a folder which contains, among other files, the satellite image of interest in JPG format.
Now, I have performed my first attempts at land cover classification in QGIS with the Semi-Automatic Classification Plugin using this JPG satellite images. Is it correct to use this file format? As far as I understand, the quality and resolution is lesser, but for simple land cover classification excercises, I was wondering if it is enough.
Thank you very much again, and I hope that everything is going well despite the COVID outbreak.
Sounds like you’re on the right track. Yes, the TIF files are the ones you’re looking for. You also chose a great plugin to work with in QGIS.
I need .las or .laz, cant find any. Know anything about this? Thanks for all the answers. I followed, but in digital elevation they have removed lidar. Searching for criteria no one has las or lidar.
If you need LAS files, take a look at our list of free LiDAR data sources – https://gisgeography.com/top-6-free-lidar-data-sources/
How could I download DEM for one watershed only from the basin?
You’ll have to mosaic and clip it based on the tiles that you download.
I’ve gone through the process and have downloaded the TIF (LC08_L1TP_039035_20191007_20191018_01_T1.tar.gz – TAR+GZIP archive, unpacked size 1,763,772,890 bytes). In the zip file there are 12 TIFs; all are 117,588,858 except one which is 470,169,358. None are in color. My mission is to obtain one high quality color aerial photo. Is this (ID:LC08_L1TP_039035_20191007_20191018_01_T1) the correct option?
Hi Gene – The reason why it’s not in color is because you need to combine the red, green and blue bands into a color composite image. Here’s an article that will help you do this. https://gisgeography.com/arcgis-composite-bands/
Is this Landsat-8 or Sentinel-2?
Here are possible band combinations for Sentinel-2: https://gisgeography.com/sentinel-2-bands-combinations/
Then, here are band combinations for Landsat-8: https://gisgeography.com/landsat-8-bands-combinations/
all links to earth explorer are say that the specified URL cannot be found. What is the new url?
The links work for me
Can this site be used to look at 3d Lidar Maps?
Yes, you can preview LiDAR in here. However, resolution is likely downgraded. Be sure to look at our free LiDAR sources here. https://gisgeography.com/top-6-free-lidar-data-sources/
If you want to just check out any LiDAR, check out this one Esri made. They’re part of point cloud layers. I think it’s pretty neat. https://developers.arcgis.com/javascript/latest/sample-code/layers-pointcloud-portal/index.html
Other cool 3d maps are here – https://gisgeography.com/esri-javascript-api-webmaps-webscenes/
Hi I am trying to get high resolution height maps in grey scale… What will you recommend is the best way to go about it in USGS. Thanks in advance
How high resolution do you need? LiDAR is the highest it gets. But coverage gets sparse compared to the global SRTM. Here are your best options for LiDAR. https://gisgeography.com/top-6-free-lidar-data-sources/
I am interested in USGS SRTM data set for a region in Liberia.
Hello, I need an aerial image of a cemetery and its adjacent area – exactly how do I do this? I am very confused by all that is involved with this procedure you are explaining? Is there a service that I can contact to do this for me? I also need this image printed out on a d sized paper. Thank you for all your assistance.
Was there anything in particular that you need help with in the tutorial?
I have USGS account but I could not download data because download button is hidden from my account please tell me how I fix the problem?
I’ve never seen that happen before. Not sure why that’s happening
excusez pour le premier message!
je disait que je travail sur les études d’impacts des feux de brousses sur les ressources naturel; alors après documentation je dois utiliser les données du produits MODIS. d’abord j’ai un soucis de téléchargement et aussi il y’a assez de canaux , comment dois-je savoir la bonne pour mon étude. s’il vous plait, aidez moi car c’est mon mémoire de fin d’étude que je rédige et la soutenance est prévu dans 3 mois
I am doing research on urban heat islands. How do I get thermal images of the area I am doing the study on?
After you download your Landsat-8 area of interest, it will come as a zip file. Extract it. Next, you will use bands 10 or 11. These are the thermal infrared (TIR) bands you will use in your study
Please answer my enquiry above. I need IR scanning of the eight US states: Ohio, PA, WV, KY, MT, UT, CO, WY to determine if coal mine fires listed on the AMLIS List are still burning and where in the mine area the heat is being produced. I can do this with IR scans. What is the best resolution of these scans you can provide.
I apologize, but I don’t know the answer to your question. If there’s smoke, perhaps these active fire maps could be of assistance? https://gisgeography.com/wildfire-maps-real-time/
I have latitude and longitude numbers to 1/10th a degree to view images of location in the infrared spectrum. Can you accommodate me?
I was able to understand most of the information here but I’m confused about something. If I want to do research about air pollution or air quality, what data set should I mark? And after I get them how do I proceed?
Here’a bit more information on the bands available for Landsat 1 to 8. Scroll down to band designations.
https://gisgeography.com/landsat-program-satellite-imagery-bands/
After you download the data, you’ll want to examine the spectral properties and some of the characteristics they are better at picking up. For example, you may be interested in the thermal infrared and SWIR bands.
https://gisgeography.com/spectral-signature/
But you may want to look at some of the other research articles that have been published. NASA’s Earth Observatory has air pollution (carbon monoxide, aerosols, etc) already in monthly products.
https://earthobservatory.nasa.gov/global-maps
I followed these instructions (they’re very clear and helpful–thank you!) but when I reach the end and “click here to download results”, there is no geoTIFF option, just csv, shapefile, kmz, and some other random formats. (I was looking at an area including the US Northeast and tried both the L8 OLI/TIRS and L7 ETM+ layers from the Collection 1 Level 1 Landsat data.) I chose the shapefile as it seemed to be the best option–I’m just trying to get a basemap image. All the documentation I can find online says that satellite data usually comes in single color band raster layers that you can stack to get the composite image, but this shapefile I downloaded has a really confusing structure and I can’t figure out how to read it as a normal image (I’m using the raster and sf packages in R). When I try to plot it, I just see a random array of colored panels. How do I either transform this shapefile into the correct satellite image, or download the geoTIFF files?
For reference, the object I downloaded contains the following elements for each of 100 square panels:
[1] “ID” “ENTITY_ID” “UL_LAT” “UL_LON” “UR_LAT”
[6] “UR_LON” “LR_LAT” “LR_LON” “LL_LAT” “LL_LON”
[11] “CENTER_LAT” “CENTER_LON” “ACQ_DATE” “WRS_PATH” “WRS_ROW”
[16] “geometry”
1. So you set your “Search criteria” – I usually just zoom into my area of interest and click “Use Map”. I zoom out and I can see that this area in red has been highlighted and is will filter out my selection to this area.
2. In the “Data Sets” tab, click the plus symbol for Landsat. As you mentioned, click Landsat-8 OLI/TIRS C1 Level-1 or Landsat-7 ETM+ C1 Level-1.
3. In “Additional Criteria”, users usually switch cloud cover option to “Less than 10%”
4. Finally, in the “Results” section – click on the “Download Options” button and choose the GeoTIFF that’s largest in size (Level-1 GeoTIFF Data Product). So there shouldn’t be a shapefile in here that you can download.
Like many others, this is all Greek to me. However, the reason I am looking into this at all, is that we need the satellite data and a means to interpret it in order to update our old floodplain maps. It does not need to be official or certified, just reasonably accurate. How difficult would this be to accomplish, and how big of an area can we cover?
For floodplain maps, I think you may interested in the SRTM Digital Elevation Model (DEM) – https://gisgeography.com/srtm-shuttle-radar-topography-mission/
In Earth Explorer, you can find this in the “data sets” tab. Next, expand “Digital Elevation”. Then, you’ll have to expand SRTM which is at the bottom. Go through the steps for picking your area of interest and download the “SRTM 1-ArcSecond Global DEM”.
I’m doing a research on change detection analysis of urban sprawl for 1985, 1995,2005 2015. I wanted Sentinel satellite images because of resolution but cannot get for that period since they only cover from 2016. I have decided to use Landsat but when I download cannot get georeferenced ones and aslo they are full of cloud cover. Kindly assist
Under the “Additional” tab is how you can set the cloud cover. For example, you can filter scenes which have less than 10% cloud cover.
who can guide me how to download 30m DEM data for my selected region
From USGS Earth Explorer, you can download SRTM 1 ArcSecond which is about 30-meter pixel size.
https://gisgeography.com/srtm-shuttle-radar-topography-mission/
Thanks!
Are location coordinates (i.e. GPS data) in Earth Explorer subject to copyright restrictions?
I am creating an adventure game that will make use of such coordinates,and I would like to
know if it would be okay to do this. (Note: No maps or images will be used)
Not too sure, you’ll have to talk with the USGS
Does anyone know if the server can be access by TMS, WMS or WMTS tile maps. Is there copyright limits on the imagery as with anything that has to do with Google….
Thanks for any help.
Can you be more specific for which imagery that you want a service for? For example, Esri has services for some of the USGS Landsat data here – https://www.esri.com/about/newsroom/arcuser/current-landsat-8-image-services-in-arcgis-online/
In general, the USGS Earth Explorer is US-based satellite data. The basemap is Google on the USGS Earth Explorer. When you download other data say Sentinel-2, it will prompt you with information on ESA’s restrictions.
Sorry, I may have misunderstood your question.
Wow, no instructions on how to download imagery, just vague waffle. You need to give clear and concise instructions. I would rather the Earth Explorer was a program/site that was *usable* instead of inept but if you are going to have an article called “How to download free Landsat imagery with USGS Earth Explorer?” the least you can do is provide instructions.
Hi Jim, thanks for the comment. I have updated the article hoping that it’s a bit clearer. Let us know specifically where you are having issues… As with everyone, we are happy to help out wherever we can.
Guys, try to use EOS to grab free satellite Landsat 8 or Sentinel-2A imagery. Also number of Indices, suitable for geology, vegetation studies etc. generated to your browser on-the-fly.
In the time filter, you have to enter MM/DD/YYYY – so in your case it would be 01/01/1985 to 12/31/2015. From there, you have to choose the Landsat archive where you can download Landsat TM, Landsat ETM, OLR/TIRS, etc.
This post explains to you about Landsat band designations and which Landsat satellites were available for those periods of time: https://gisgeography.com/landsat-program-satellite-imagery-bands/
Hope that helps.
I’m doing research on application of GIS and Remote sensing in monitoring Forest degradation and Forest deforestation b/n 1985 and 2015 so please help me in providing landsat data of R141/P41
Suggested next topic: “I’ve downloaded imagery, now what?”.
Would love to know the basics of processing this data once I grab it from the USGS.
Good work on this! Cheers!
I’m doing research on application of GIS and Remote sensing in monitoring Forest degradation and Forest deforestation. so please help me in providing landsat data of R141/P41
Go to: http://earthexplorer.usgs.gov/
Under the Data Sets tab. Expand EO-1. Select EO-1 Hyperion. This will give you hyperspectral data.
Please indicate how to access Hyper spectral images data for geological explorations. I am finding difficulty in downloading free images so that we can work on projects