OBIA – Object-Based Image Analysis (GEOBIA)
Think objects, not pixels
How amazing would it be if you could digitize all your features in an image with just a click of a button?
On top of that, you can classify each feature with another click of a button.
Sounds like magic? But these two processes are segmentation and classification performed in Object-based Image Analysis (OBIA).
Let’s examine what it is and how you can use it to get your work done more efficiently and accurately.
Segmentation is key to classification
Human visual perception almost always outperforms computer vision algorithms.
For example, your eyes know a river when they see one. But a computer can’t recognize rivers from lakes.
…Or can it?
Traditional pixel-based image classification assigns a land cover class per pixel. All pixels are the same size, same shape, and don’t have any concept of their neighbors.
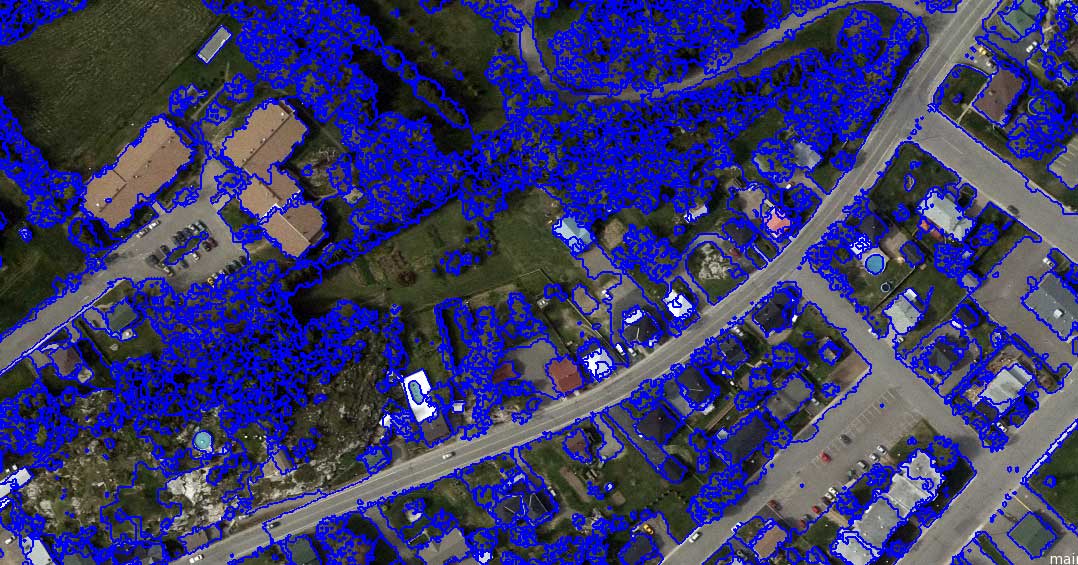
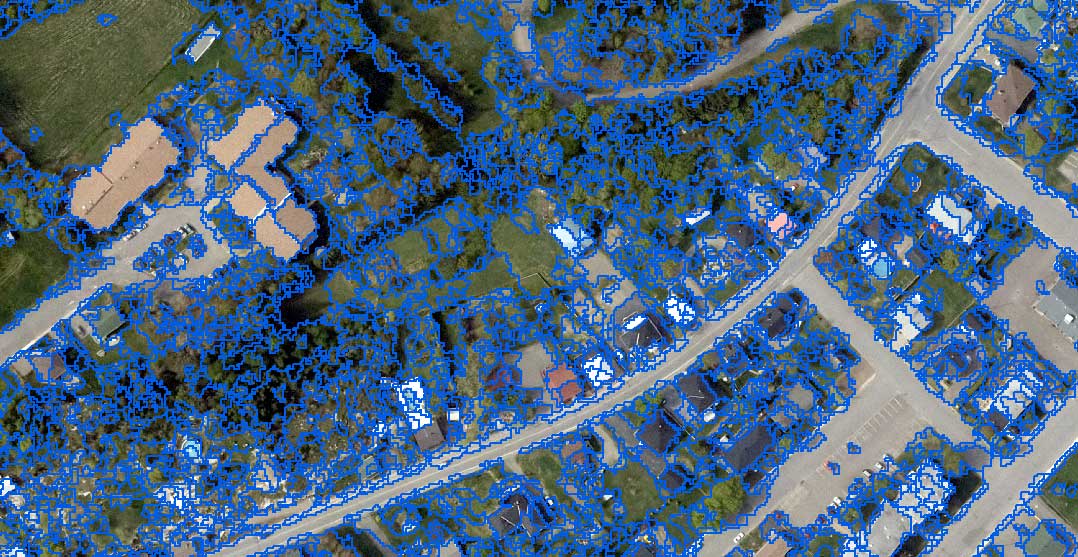
However, OBIA segments an image grouping small pixels together into vector objects. Instead of a per-pixel basis, segmentation automatically digitizes the image for you.
What segmentation does is replicate what your eyes are doing.
But with these segmented objects, you use their spectral, geometrical, and spatial properties to classify them into land cover.
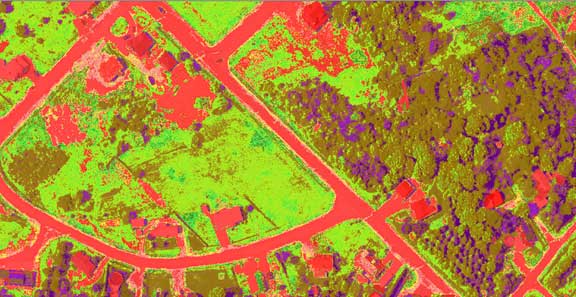
Otherwise, when you use traditional image classification techniques, you often get a salt-and-pepper look in the classification result.
To recap, the two basic principles of OBIA are:
- SEGMENTATION: Break the image up into objects representing land-based features.
- CLASSIFICATION: Classify those objects using their shape, size, spatial and spectral properties.
Let’s dig a bit deeper into these two concepts.
Generate meaningful objects with segmentation
When you segment an image, the process groups pixels to form objects. Suddenly, land cover features start popping out, similar to how your eyes process your surroundings.
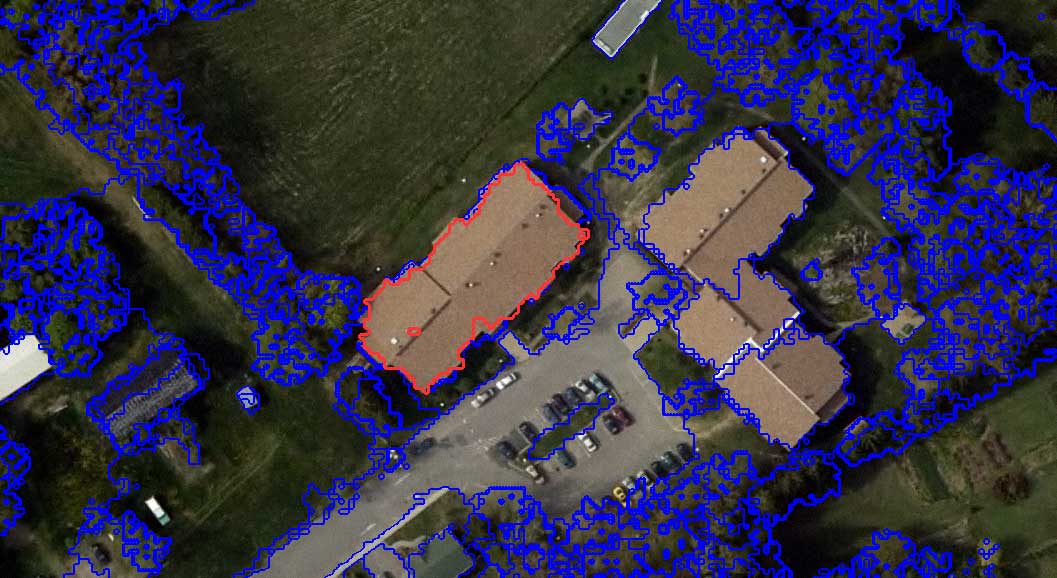
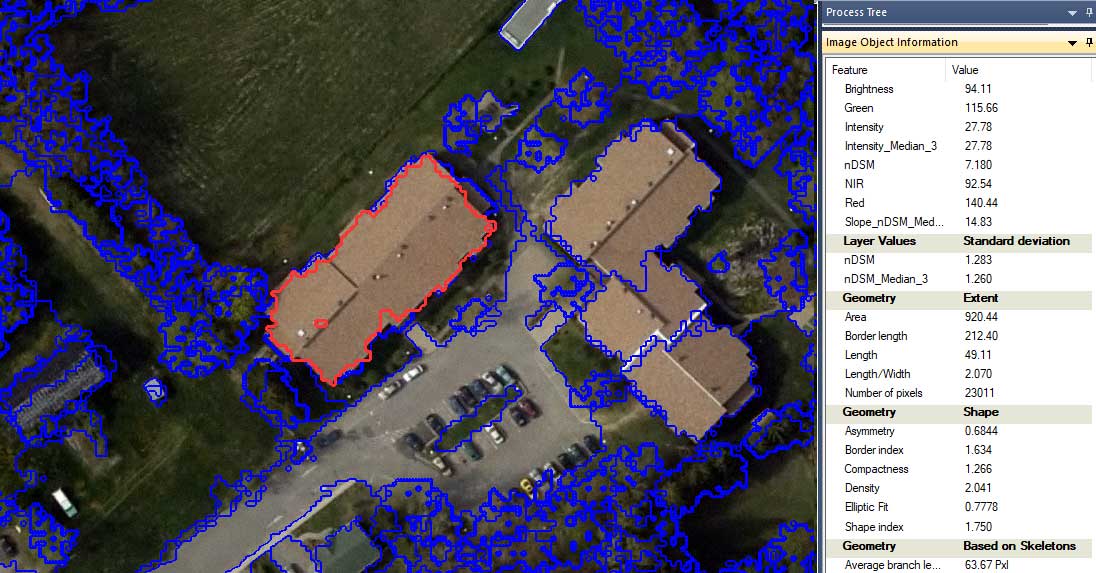
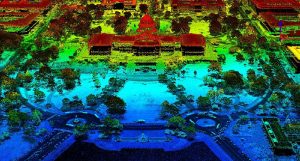
For this 50cm resolution image, the multi-resolution segmentation algorithm breaks up an image in eCognition Definiens Developer. Based on your compactness and shape settings, this is the preliminary step in OBIA.
How big do you want the objects to be? There’s a scale parameter that you can estimate to generate more meaningful objects.
Also, you can configure weights for all the layers you want to segment. This means that you don’t only have to segment by red, green, or blue, but you can also segment a DEM, DSM, NIR, or even LiDAR intensity.
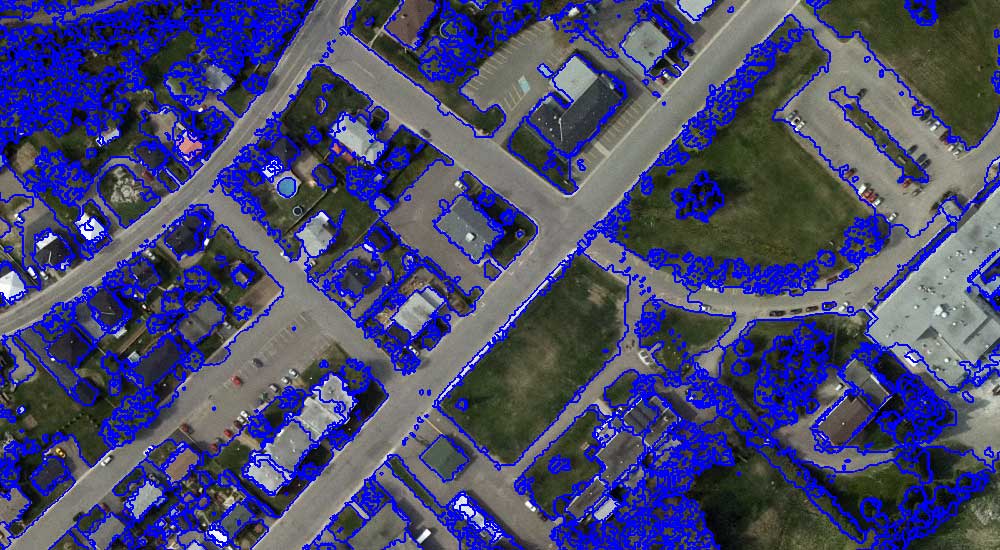
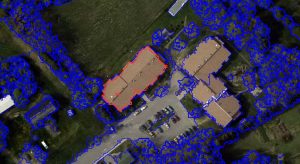
Similarly, the segment mean shift in ArcGIS is an alternative method of object-based image analysis. However, you don’t have as many options as Trimble eCognition.
For example, you can’t set the weights of several layers when you run the process. What you can do is set the spectral and spatial detail, along with the minimum size in pixels. With a bit of trial and error, we used the raster calculator to set custom weights using an nDSM and the red band as input.
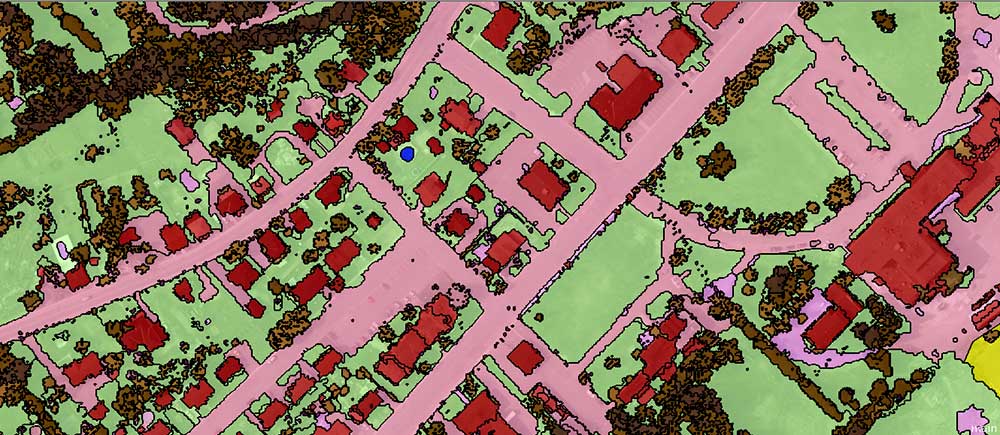
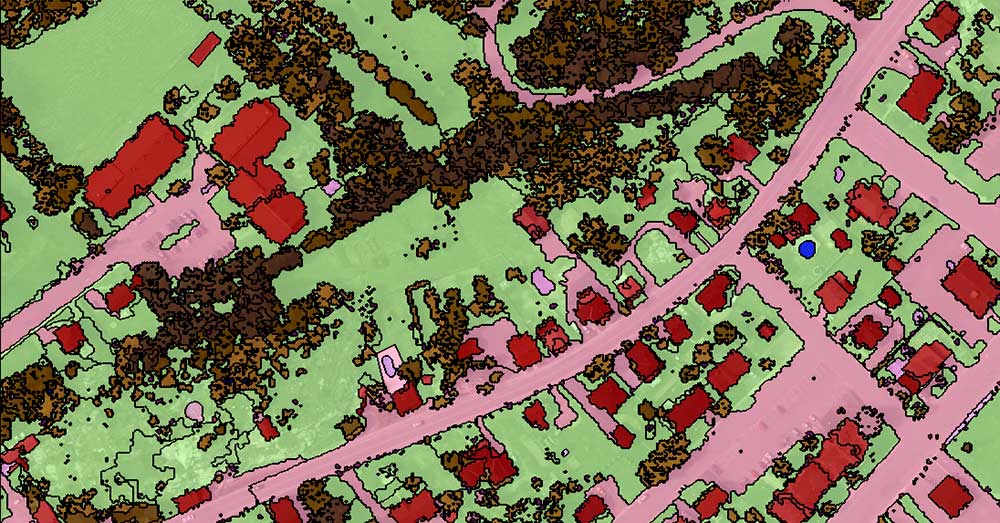
Classify land cover features
After you segment the image, it’s time to classify each object. You are now able to classify because each object has statistics associated with it. For example, you can classify objects based on geometry, area, color, shape, texture, adjacency, and more.
While options are limiting in ArcGIS, this is where the true power lies in Trimble eCognition. In this example, there are seemingly endless statistics to classify buildings. But which statistic is the correct one to use?
Admittedly, there is no best way to classify land cover features using OBIA. However, analysts frequently use these statistics to classify land cover using OBIA:
- WATER is flat (low nDSM), it accumulates into depressions (high TWI or low TPI), it has a low temperature (thermal infrared – TIRS) and it has high near-infrared absorption (negative NDVI)
- TREES have varying heights (high nDSM standard deviation) and have high near-infrared reflectance (high NDVI).
- BUILDINGS are often rectangular (high rectangular fit), are tall (high nDSM), and have high slopes.
- GRASS is short (low nDSM), it’s flat (low nDSM standard deviation), and has moderate near-infrared reflectance (moderate NDVI).
- ROADS reflect a lot of light (high RGB), they are flat (low nDSM), have a high light intensity, and have a low or negative NDVI.
You can set up rulesets, which are a set of pre-defined steps to segment and classify objects. Similar to ModelBuilder in ArcGIS, it steps through each process until it finishes.
Alternatively, Trimble ECognition has a nearest neighbor classification where you add and classify based on defined samples.
Sharper images = More advanced image classification
In 1972, Landsat-1 sparked a revolution in how we monitor our Earth. With the US government relaxing regulations on high-resolution satellite data, the uptrend in sharper imagery is simply remarkable.
It’s not only satellites like Worldview or Planet Labs but the usage of LiDAR and drones like DJI are seeing a healthy uptick. And the way we classify images has progressed from unsupervised to more sophisticated object-based image classification.
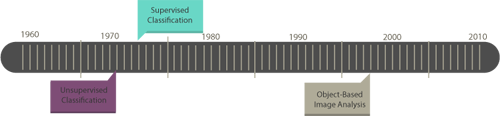
When a single pixel contained several buildings in a Landsat-1 scene, there wasn’t a need to do object-based image analysis. However, the new breed of high-resolution data requires object-based image analysis.
For example, a Landsat-1 scene couldn’t decipher between buildings from parks. In this case, unsupervised and supervised classification was enough. But now, you segment and classify high-resolution data using OBIA for more meaningful land cover. This is the trend in the remote sensing community.
Otherwise, traditional image classification techniques give unwanted salt and pepper classification.
OBIA – Object-based Image Analysis
OBIA started with cellular biologists dissecting image scans. GEOBIA (Geographic Object-Based Image Analysis) distinguishes it from its medical origin.
Crisper images, more spectral bands, and an explosion of data acquisitions can help solve today’s problems.

To make sense of all this information, we need OBIA or object-based image analysis to automate some of the work for us.
As each day passes by, satellites collect ridiculous volumes of data silently in orbit… But what good is satellite data if you don’t know how to use it?
OBIA is about mass production. You create a ruleset, run it, and edit your classification as necessary.

I am working on Object-based image analysis by using Jupyter Notebook
…Can I do it? Can you please guide me through this?
Hi Nikam. My only experience is using eCognition and ArcGIS Pro.
I’ve created this eCognition guide to OBIA – https://gisgeography.com/nearest-neighbor-classification-guide-ecognition/
I haven’t created a guide yet for ArcGIS Pro. But the process includes using the Mean Segment Shift algorithm. From there, you use spectral characteristics to classify objects.
The main disadvantage of Esri is the limited number of statistical properties compared to eCognition. I find eCognition much more superior than ArcGIS Pro.
Let me know if you have any questions about any of these two… Unfortunately, I can’t be much assistance for Jupyter Notebooks
Hi
I have a problem when its come to classifying informal settlements, since some of the material they are using are exactly the same as those that are used for buildings in CBDs.
This is definitely a common issue in any type of image classification
For geobia there is software (open) developed by INPE in Brazil, called TerraView which has a tool called geoDMA developed for this purpose
Thanks for your efforts, such a great educational website ☆☆☆
Hello, As FAR as I know, QGIS has plugin called Orfeo Toolbox which can be use to OBIA. Feel free to use it.
To correct @GISGeography, it is indeed very possible to use OBIA techniques in QGIS (I am doing it). QGIS incorporates GRASS, SAGA and Orfeo Toolbox all of which have OBIA features that can match ArcGIS and the latest version of Orfeo arguably surpasses that offered by ESRI.
See (a few quick random links that are hopefully useful):
1) https://grasswiki.osgeo.org/wiki/Image_classification#Further_reading_on_OBIA_with_GRASS_GIS
2) https://sagatutorials.wordpress.com/segmentationobia-videos/
3) http://wiki.awf.forst.uni-goettingen.de/wiki/index.php/Object-based_classification_(Tutorial)
A Google search will generate many more examples of OBIA through QGIS.
Is it possible to work with OBIA in QGIS?
what are other open code software do you recommend?
I don’t think that it’s possible to work in QGIS using OBIA. Esri has a new OBIA technique called the “Segment Mean Shift”. But this isn’t open source.
Other than this, there are Python libraries with segmentation modules. For example, the Remote Sensing and GIS Software Library (RSGISLib) is available free of charge – provided freely under a GPL3 license.
Thank you so much for this overview, this is very appreciated :)