Multispectral vs Hyperspectral Imagery Explained
The main difference between multispectral and hyperspectral is the number of bands and how narrow the bands are.
Multispectral imagery generally refers to 3 to 10 bands. Each band has a descriptive title.
Today, we will explore the differences between these types of imagery.
We also hope to provide you with an intuition about the EM spectrum and the different types of sensors with these capabilities.
What are the Differences Between Multispectral and Hyperspectral Imagery?
The main difference between multispectral and hyperspectral is the number and the spectra of electromagnetic radiation that each band contains.
For example, the channels below include red, green, blue, near-infrared, and short-wave infrared.
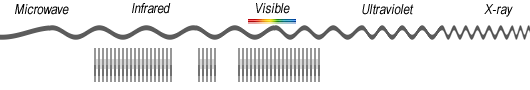
Hyperspectral imagery consists of much narrower bands (10-20 nm). A hyperspectral image could have hundreds or thousands of bands. In general, they don’t have descriptive channel names.
What is Multispectral Imagery?
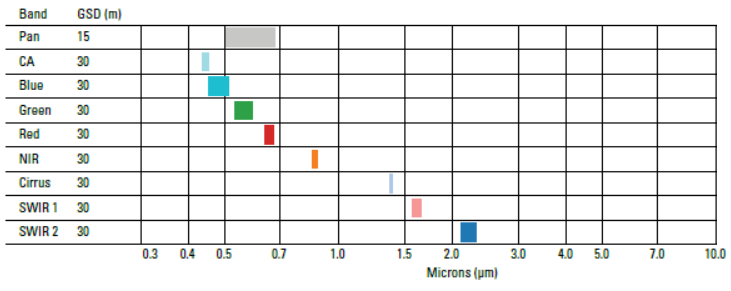
An example of a multispectral sensor is Landsat-8. For example, Landsat-8 produces 11 images with the following bands:
- COASTAL AEROSOL in band 1 (0.43-0.45 um)
- BLUE in band 2 (0.45-0.51 um)
- GREEN in band 3 (0.53-0.59 um)
- RED in band 4 (0.64-0.67 um)
- NEAR INFRARED (NIR) in band 5 (0.85-0.88 um)
- SHORT-WAVE INFRARED (SWIR 1) in band 6 (1.57-1.65 um)
- SHORT-WAVE INFRARED (SWIR 2) in band 7 (2.11-2.29 um)
- PANCHROMATIC in band 8 (0.50-0.68 um)
- CIRRUS in band 9 (1.36-1.38 um)
- THERMAL INFRARED (TIRS 1) in band 10 (10.60-11.19 um)
- THERMAL INFRARED (TIRS 2) in band 11 (11.50-12.51 um)
Each band has a spatial resolution of 30 meters except for bands 8, 10, and 11. While band 8 has a spatial resolution of 15 meters, bands 10 and 11 have a 100-meter pixel size. Because the atmosphere absorbs light in these wavelengths, there is no band in the 0.88-1.36 range.
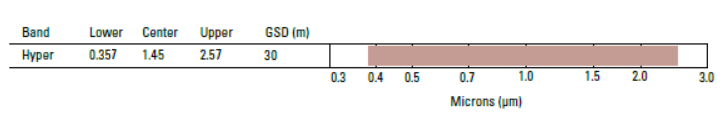
What is Hyperspectral Imagery?
In 1994, NASA planned the first hyperspectral satellite called the TRW Lewis. Unfortunately, NASA lost contact with it shortly after its launch.
But later NASA did have a successful launch mission. In 2000, NASA launched the EO-1 satellite which carried the hyperspectral sensor “Hyperion”. In fact, the Hyperion imaging spectrometer (part of the EO-1 satellite) was the first hyperspectral sensor from space.
Hyperion produces 30-meter resolution images in 242 spectral bands (0.4-2.5 um). If you want to test out Hyperion imagery for yourself, you can download the data for free on the USGS Earth Explorer.
Hyperion really kicked off the start of hyperspectral imaging from space. For example, other hyperspectral imaging missions from space include:
- PROBA-1 (ESA) in 2001
- PRISMA (Italy) in 2019
- EnMap (Germany) in 2020
- HISUI (Japan) in 2020
- HyspIRI (United States) in 2024
An Intuition for Multispectral and Hyperspectral
When you read this post, your eyes see the reflected energy. But a computer sees it in three channels: red, green and blue.
- If you were a goldfish, you would see light differently. A goldfish can see infrared radiation which is invisible to the human eye.
- Bumble bees can see ultraviolet light. Again, humans can’t see ultraviolet radiation from our eyes but UV-B harms us.
Now, imagine if we could view the world in the eyes of a human, goldfish, and bumblebee. Actually, we can. We do this with multispectral and hyperspectral sensors.
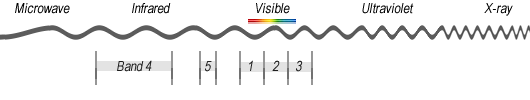
Multispectral vs Hyperspectral Imagery
- Multispectral: 3-10 wider bands.
- Hyperspectral: Hundreds of narrow bands.
The Electromagnetic Spectrum
Visible (red, green, and blue), infrared and ultraviolet are descriptive regions in the electromagnetic spectrum. We, humans made up these regions for our own purpose – to conveniently classify them. Each region is categorized based on its frequency (v).
- Humans see visible light (380 nm to 700 nm)
- And goldfish see infrared (700 nm to 1mm)
- Bumble bees see ultraviolet (10 nm to 380 nm)
Multispectral and hyperspectral imagery gives the power to see like humans (red, green, and blue), goldfish (infrared), and bumblebees (ultraviolet). Actually, we can see even more than this as reflected EM radiation to the sensor.
Summary: Multispectral vs Hyperspectral
Having a higher level of spectral detail in hyperspectral images gives the better capability to see the unseen. For example, hyperspectral remote sensing distinguished between 3 minerals because of their high spectral resolution. But the multispectral Landsat Thematic Mapper could not distinguish between the 3 minerals.
But one of the downfalls is that it adds a level of complexity. If you have 200 narrow bands to work with, how can you reduce redundancy between channels?
Hyperspectral and multispectral images have many real-world applications. For example, we use hyperspectral imagery to map invasive species and help in mineral exploration.
There are hundreds more applications where multispectral and hyperspectral enable us to understand the world. For example, we use it in the fields of agriculture, ecology, oil and gas, atmospheric studies, and more.

What sensor do I need for plant disease and pest detection? And can you give me a hint on how the process can be done?
Which satellite and what will be the combination of bandwidth to be used to work with forest tree canopy and what are the other things that we should focus on if we want to work with satellite images.
You’re probably looking for the near-infrared band and use NDVI (Normalized Difference Vegetation Index). So something free would be Landsat (30 meters) or Sentinel-2 (10 meters)
Here are some of the Landsat 8 band combinations as well here is an explainer on NDVI.
Very educative and helpful resource
Gentlemen, my name is Edson CO Mota, I am a technician in telecommunications and I speak from São Paulo, Brazil and I would like to ask you who have the technology that is possible in this time of pandemic to carry out the spectral scan of the pathogen “sar cov 2” and make “open source” data available to hyperspectral camera companies to import this data to detect covid in the atmosphere, environment; this would be a much more effective way than biochemical tests and would bring us to another level in facing the pandemic, please think about it. Thank you ….
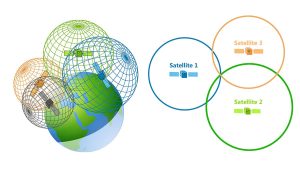
Very insightful topic. We are in the infrastructure building infrastructure like airports, roads, Energy, Ports, solar farms, wind farms, mining operations, logistics etc. A very whacky idea about having a spectral signature for each of the assets from a security standpoint. Today the hyperspectral sensors record the reflected radiation from the objects. Each of these objects has a different way to absorb the EMI and reflect which leads to spectral signatures or fingerprints for that object. If I take this principle and start tagging my physical assets with some coating or a way to identify my assets thru this, I could then monitor it from a security perspective. We have mesh satellite companies which have these mini-satellites which have Multispectral and Hyperspectral cameras and use imagery and then translate that into Data Analytics and all sort of things. I was wondering if this is at all possible to have your assets tagged in a way where we could identify immediately with the spectral signature/fingerprint which is unique to our company.
I am a Consulting Arborist and am interested in using multispectral imagery to assess trees. I would like to be able to determine species, health, condition, and specific diseases/pests.
Can this be done with multi camera such as micasense red-edge or would I need a hyper camera? Also more important is the a service that can interpret the data and provide proscription?
If not, where can I find the software so I can build the data set I need?
Is there hyperspectral imagery available that could be used to discern various gases ebulating in a water body (e.g., river or embayment)? The gases are released when bubbles come to the surface – we’d need cm-level imagery to see the bubbles (not available commercially, to my knowledge), but what about non-visible bandwidths to “see” the gases that are released – nitrogen versus methane?
Hi Cliff, this is a challenging question to answer. Yes, commercial satellites probably won’t be able to achieve the resolution you need. From my knowlege, Worldview-2/3/4 is still the sharpest imagery you can get and it’s a bit finer than 0.5 meter.
As for the question, how to measure methane, I apologize but this is a bit out of my area of specialization… What I would do is look at studies that have had success in doing this. For example, Measurement of Pollution in the Troposphere (MOPITT) onboard Terra satellite has had success measuring CH4. The methodology that NASA uses is described here –
https://asdc.larc.nasa.gov/documents/mopitt/guide/ASDC_MOPITT_Overview_2015.pdf
Hopefully, someone else here can assist you for measuring methane and nitrogen through remote sensing.
Saleh, satellite-based radar (SAR) has ~1m penetration under ideal conditions (dry sand) and 0m under poor conditions (wet clay). Alternatively, ground penetrating radar (GPR) extends that to 10’s of metres (but similarly requires (the same) good conditions).
This helps a lot in my studies. Thank you.
Hello all,
We are conducting a door to door survey in an IDP site-Afghanistan, we had ordered a multi-spectral image with 0.5m pixel size. However, a company did send us a quotation saying we have image of panchromatic 0.5m and red-blue-green-infrared in 2m resolution. so they gonna send us a pan-sharpened type of image. Do you think it will work for our detailed door to door survey?
What type of spectrum is useful for exploration groundwater? and what depth of penetration ground when using radar?
Depends on what you are trying to do. This article should help you with some of the spectral bands commonly found in multispectral sensors like Landsat-7/8 (free), Sentinel 2A/2B (free) and Worldview-2/3 – https://gisgeography.com/spectral-signature/
The more specific detail you need, the more spectral resolution (hyperspectral) would be beneficial
Which camera is good for agriculture purposes?
Short answer is that you’ll be able to discern better between Earth’s features with higher spectral resolution. For example, in the mining industry there are over 4000 different types of minerals. Each mineral has its own composition. This is the equivalent to saying each mineral has its own spectral composition and spectral signature – https://gisgeography.com/spectral-signature/
With multispectral data, reflected energy in the EM spectrum spans a wider range. So you don’t get the level of detail as hyperspectral. The graph in the spectral signature page (link above) is just an example, but there would only be a couple of points on it using multispectral data (for each band). But with hyperspectral data, there could potentially be hundreds of points for each band. This means you have much more detail
What are the advantages and disadvantages of wider and narrow bands?
It’s a good article but I need more clarification about multispectral data