Sentinel 2 Bands and Combinations

Sentinel 2 Bands and Combinations
There are 13 Sentinel-2 bands in total. Each band is 10, 20, or 60 meters in pixel size.
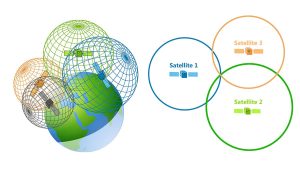
Sentinel 2 consists of 2 satellites. First came Sentinel 2A which was launched in 2015. Next came Sentinel 2b in 2017.
Two additional satellites (Sentinel 2C and 2D) are planned to launch in 2024. This will make a total of four Sentinel-2 satellites.
Overall, these 2 additional satellites will cut the revisit time in half.
Sentinel 2 Bands
Sentinel-2 carries the Multispectral Imager (MSI). This sensor delivers 13 spectral bands ranging from 10 to 60-meter pixel size.
- Its blue (B2), green (B3), red (B4), and near-infrared (B8) channels have a 10-meter resolution.
- Next, its red edge (B5), near-infrared NIR (B6, B7, and B8A), and short-wave infrared SWIR (B11 and B12) have a ground sampling distance of 20 meters.
- Finally, its coastal aerosol (B1) and cirrus band (B10) have a 60-meter pixel size.
| Band | Resolution | Central Wavelength | Description |
|---|---|---|---|
| B1 | 60 m | 443 nm | Ultra Blue (Coastal and Aerosol) |
| B2 | 10 m | 490 nm | Blue |
| B3 | 10 m | 560 nm | Green |
| B4 | 10 m | 665 nm | Red |
| B5 | 20 m | 705 nm | Visible and Near Infrared (VNIR) |
| B6 | 20 m | 740 nm | Visible and Near Infrared (VNIR) |
| B7 | 20 m | 783 nm | Visible and Near Infrared (VNIR) |
| B8 | 10 m | 842 nm | Visible and Near Infrared (VNIR) |
| B8a | 20 m | 865 nm | Visible and Near Infrared (VNIR) |
| B9 | 60 m | 940 nm | Short Wave Infrared (SWIR) |
| B10 | 60 m | 1375 nm | Short Wave Infrared (SWIR) |
| B11 | 20 m | 1610 nm | Short Wave Infrared (SWIR) |
| B12 | 20 m | 2190 nm | Short Wave Infrared (SWIR) |
Sentinel Band Combinations
We use band combinations to better understand the features in imagery. The way we do this is by rearranging the available channels in creative ways.
By using band combinations, we can extract specific information from an image. For example, there are band combinations that highlight geologic, agricultural, or vegetation features in an image.
If you want to see Sentinel band combinations for yourself, you can check out the Sentinel Playground. It visualizes the band combinations below, as well as several more.
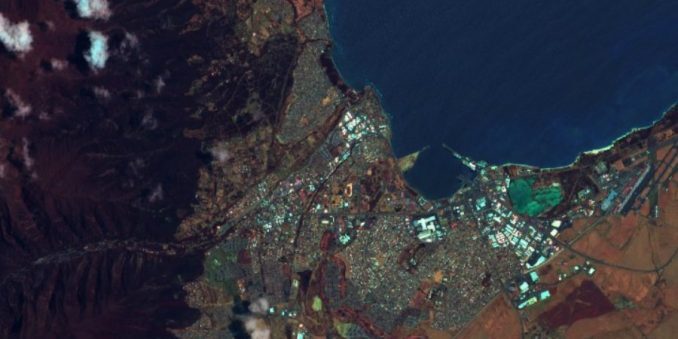
Natural Color (B4, B3, B2)
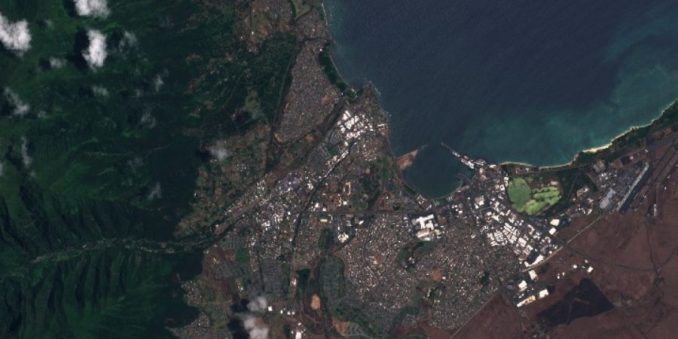
The natural color band combination uses the red (B4), green (B3), and blue (B2) channels. Its purpose is to display imagery the same way our eyes see the world. Just like how we see, healthy vegetation is green. Next, urban features often appear white and grey. Finally, water is a shade of dark blue depending on how clean it is.
Color Infrared (B8, B4, B3)
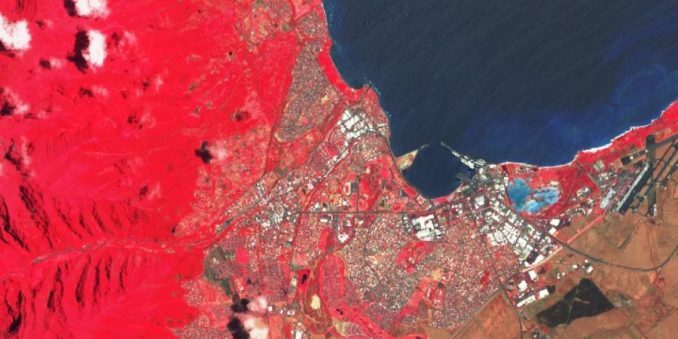
The color infrared band combination is meant to emphasize healthy and unhealthy vegetation. By using the near-infrared (B8) band, it’s especially good at reflecting chlorophyll. This is why in a color infrared image, denser vegetation is red. But urban areas are white.
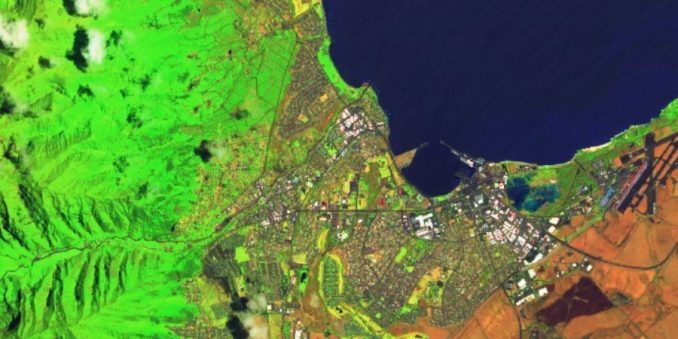
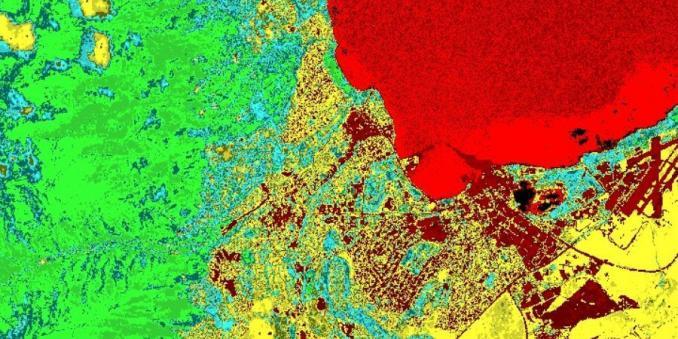
Short-Wave Infrared (B12, B8A, B4)
The short-wave infrared band combination uses SWIR (B12), NIR (B8A), and red (B4). This composite shows vegetation in various shades of green. In general, darker shades of green indicate denser vegetation. But brown is indicative of bare soil and built-up areas.
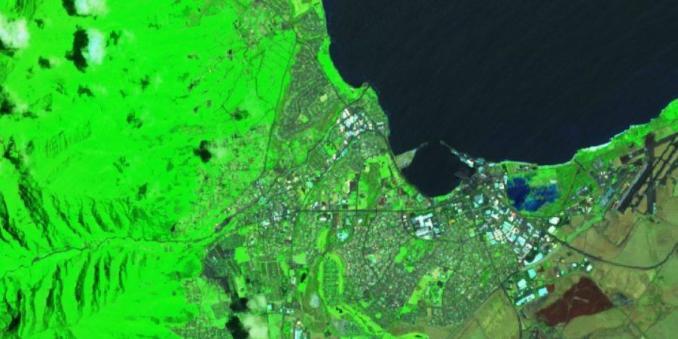
Agriculture (B11, B8, B2)
The agriculture band combination uses SWIR-1 (B11), near-infrared (B8), and blue (B2). It’s mostly used to monitor the health of crops because of how it uses short-wave and near-infrared. Both these bands are particularly good at highlighting dense vegetation that appears as dark green.
Geology (B12, B11, B2)
The geology band combination is a neat application for finding geological features. This includes faults, lithology, and geological formations. By leveraging the SWIR-2 (B12), SWIR-1 (B11), and blue (B2) bands, geologists tend to use this Sentinel band combination for their analysis.
Bathymetric (B4, B3, B1)
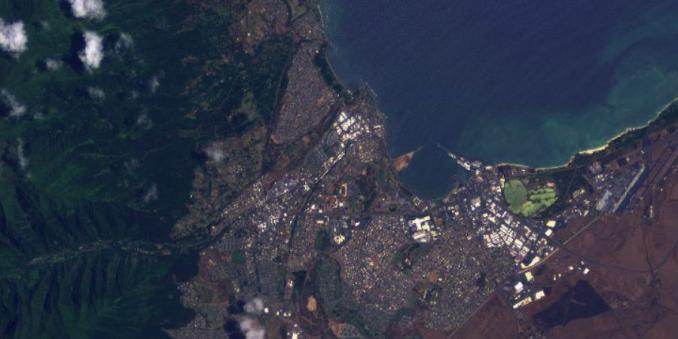
As the name implies, the bathymetric band combination is good for coastal studies. The bathymetric band combination uses the red (B4), green (B3), and coastal band (B1). Using the coastal aerosol band is good for estimating suspended sediment in the water.
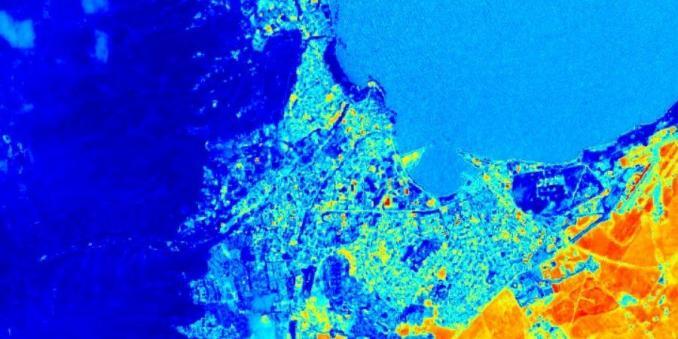
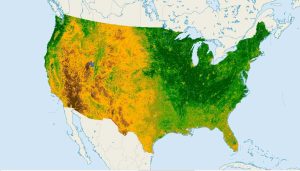
Vegetation Index (B8-B4)/(B8+B4)
Because near-infrared (which vegetation strongly reflects) and red light (which vegetation absorbs), the vegetation index is good for quantifying the amount of vegetation. The formula for the normalized difference vegetation index is (B8-B4)/(B8+B4). While high values suggest dense canopy, low or negative values indicate urban and water features.
Moisture Index (B8A-B11)/(B8A+B11)
The moisture index is ideal for finding water stress in plants. It uses the short-wave and near-infrared to generate an index of moisture content. In general, wetter vegetation has higher values. But lower moisture index values suggest plants are under stress from insufficient moisture.
Sentinel 2 Data Access and Software
If you’re looking to download Sentinel 2 data, your best bet is the Sentinel Copernicus Browser (previously known as Sentinels Scientific Data Hub)
- This data portal is managed by the European Space Agency (ESA) and contains all the latest acquisitions from all the Sentinel satellites.
- If you want a step-by-step guide, then we’ve created a tutorial on how to download Sentinel 2 imagery.
- Finally, if you’re looking to analyze, manipulate, or just visualize the imagery, the SNAP Toolbox is completely free for everyone to use.
Well, that’s it for today.
If you’re interested in reading more on band combinations, make sure to check out our spectral signatures cheatsheet.
Or if you’re just looking at finding new and creative ways to use satellite imagery, read our article on 100 remote sensing applications.

Thank you very much for this useful information
Are there suitable spectral equations to determine soil salinity using Sentinel data?
Best Regards
Spatial resolution of SWIR is incorrect in your table
What’s incorrect about it?
I believe one issue I noticed, which I am unsure if it is the same issue Mr. Doe had, is Band 9 (SWIR), which is listed in the ESA Sentinel-2 User Handbook as 945 nm instead of the 940 nm you have listed in the table.
https://sentinel.esa.int/documents/247904/685211/sentinel-2_user_handbook
Page 54 / 64
Good
For extraction of lineaments, what would be the best band combination
How can I calculate the weighted average of bands ?
Why did ESA decide to have very good measurement capabilities of this satellite in the spectral range of 640 – 900 nm?
Why did they equip the satellite with 6 spectral bands, even though 2 spectral bands would be sufficient to calculate NDVI?
What is the best combination to show the phytoplankton?
Please take a look at out our spectral signature cheatsheet for more information – Spectral Signature Cheatsheet – Spectral Bands in Remote Sensing
In some articles, NDVI =(B8a-B4)/(B8a+B4) would give better result than (B8-B4)/(B8+B4). What is the main reason for using B8a in case of vegetation study?
12/8/5 and 12/8/4 are also good band combinations for viewing forest fire burn scars and regeneration. The most severely burned areas will be dark red.
Actually came in clutch this one
Typo? “By leveraging the SWIR-2 (B12), SWIR-1 (B4) and blue (B4) bands, geologists” Should be SWIR-1(B11)?
Thanks. Yes, I fixed it.