Equal Interval Classification in GIS
What is Equal Interval Data Classification?
The equal interval classification method divides attribute values into equal-size ranges.
Unlike quantile classification, the number of records that fall into each category (or bin) will differ.
A choropleth map using equal interval classification will emphasize the amount of an attribute relative to one another.
For example, if you create 5 classes with attribute values from 0-100, the 5 classes will be 0-20, 21-40, 41-60, 61-80, and 81-100. In the example above, 100 is the maximum, and 0 is the minimum with 5 classes.
How is Equal Interval Classification Used in GIS?
If we want to show the number of letters for a state in a choropleth map, we can start counting letters for each state.
- Ohio has 4 letters
- California has 10 letters
The minimum number of letters is 4, such as Iowa or Ohio. The maximum number of letters in a state is 14 as in North or South Carolina.
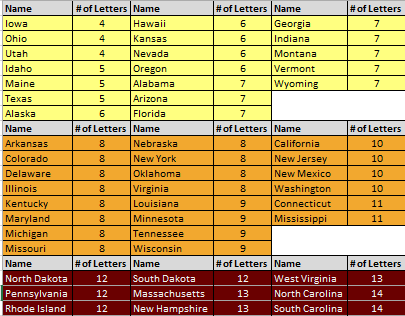
We can group the data into three classes as follows: 4-7, 8-11, and 12-14. This means that ‘Ohio’ falls in the 4-7 bin and ‘California’ belongs in the 8-11 bin. The ColorBrewer has a nice tool for color advice.
Here is a color-coded table grouping US states by the length of the state name:
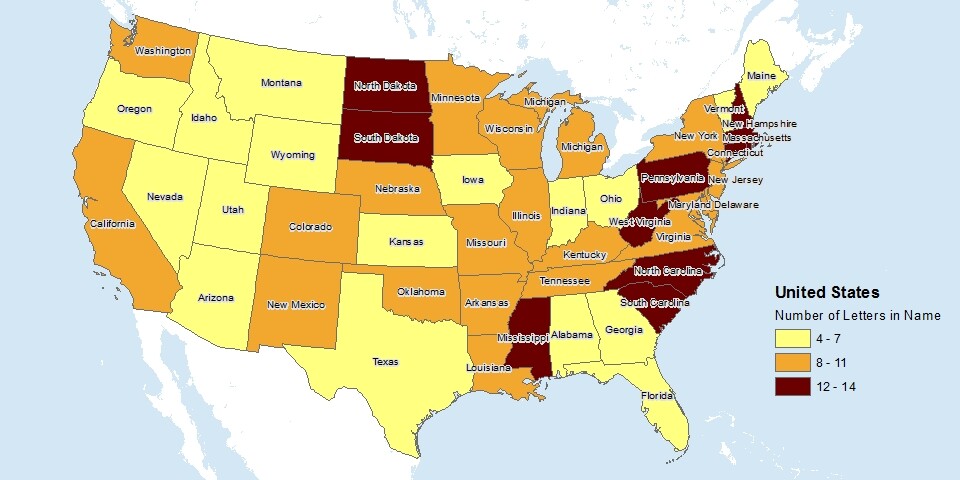
Now, that we have each US state categorized into 3 equal interval breaks, we can generate a choropleth map with these groupings.
We can see how there is an uneven number of states in each grouping because of how the data is being grouped with this classification system. And that is perfectly OK because it’s not misleading.
The map above takes the tables with the 3 groupings and shades each break based on the number of letters in the state name.
Now, it’s your turn
The equal interval classification method divides attribute values into equal-size ranges.
The number of records that fall into each bin will differ.
It’s completely based on the data and which values fall in their respective bin.
Equal intervals divided the categories equally based on the minimum and maximum values.