What Is Flow Direction in GIS?
DEFINITION:
Flow direction refers to the direction water would flow across a surface, based on elevation data (usually from a Digital Elevation Model, or DEM).
What is Flow Direction?
Flow direction answers the question “Where did the water come from”.
Hydrologists use flow direction maps to help model how surface runoff contributes to flooding.
But how does flow direction really work?
Flow direction calculates the direction water will flow using the slope from neighboring cells using a pour point model. Today, we explore the hydrology tool of flow direction.
How to Calculate Flow Direction
First, start off with a digital elevation model from one of these free DEM data sources. Flow direction determines which direction water will flow in a given cell.
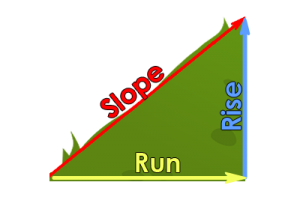
Based on the direction of the steepest descent in each cell, we measure flow direction. Also, the z-value difference and slope are calculated between neighboring cells.
In a given grid cell, water can flow to one or more of its eight adjacent cells. The slope is the ultimate factor in how water flows in this model.
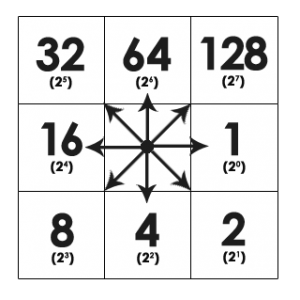
We use a pour-point model to show how and in which direction water travels. The eight adjacent cells in the pour point model have a value expressing how water drops.
Flow Direction Example
When water flows in the east direction, it has a value of 1. When water flows west, it has a value of 16. All 8 adjacent directions at a given point can be described using the eight-direction pour point model.

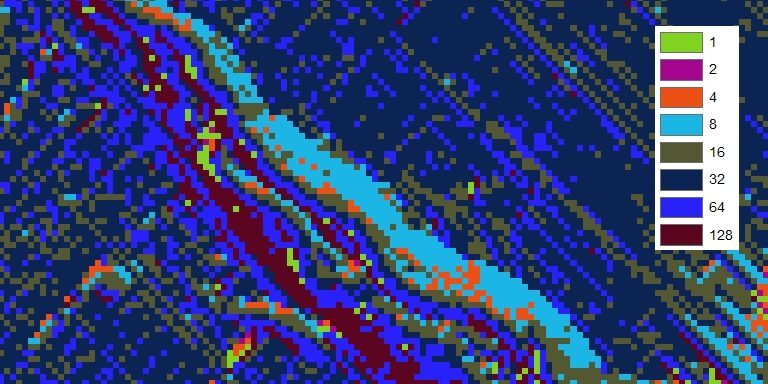
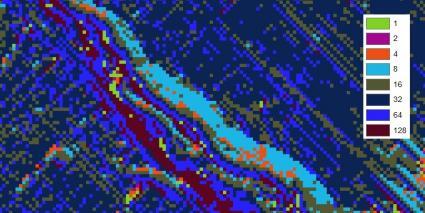
When running the flow direction algorithm, the resulting values range from 1, 2, 4, 8, 16, 32, 64, and 128. In the eight-direction pour-point model diagram, you can understand which flow direction water travels.
Now, it’s your turn
We can better understand the question “Where did the water come from” by using hydrology tools like flow accumulation and direction.
Pick a point (a single cell in the DEM) and find the slope. Each cell is illustrated with eight possible directions.
Flow accumulation traces backward showing all the contributing cells. Test it out yourself.


