7 Geoprocessing Tools Every GIS Analyst Should Know

Learn These Essential Geoprocessing Tools
So you want to geoprocess like a GIS guru, do you? Well, these 7 geoprocessing tools always top the chart in the GIS guru’s hit list. They’re our bread and butter.
From clipping to buffering, you will learn the basics of processing GIS data. And you will get a better understanding of how we use these GIS tools for real-world applications in GIS.
Which geoprocessing tools do we use most in GIS software like ArcGIS and QGIS? For newbies in GIS, we recommend you learn these 7 GIS processing tools like the back of your hand.
Ready to get started?
READ MORE: The Periodic Table for Spatial Analysis

1. The Buffer Tool
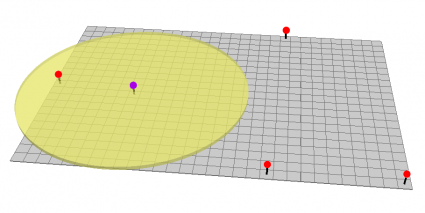
Buffers are proximity functions. When you use this geoprocessing tool, it creates a polygon at a set distance surrounding the features.
For example, a buffer is a polygon or collection of cells that are within a specified proximity of a set of features.
The buffer tool can have fixed and variable distances. Also, they can be set to geodesic which accounts for the curvature of the Earth.
Buffer Tool Example: Chernobyl Exclusion Zone
Chernobyl is the worst nuclear disaster in human history. In a short period of time, it released hundreds of times more radiation than Hiroshima. Also, it is one of only two classified as a level 7 event (the maximum classification). Surrounding vegetation absorbed radioactive isotopes and died within a week of the blast.
As a result of the deadly toxins released into the atmosphere, the safety crew declared a 2600 square kilometer buffer around the nuclear power plant. To this day, this buffer zone is still in effect and it’s called the Chernobyl exclusion zone. 30 years later, the trees remain reddish-brown. There are an estimated 9000 to 93,000 deaths across Europe. And the exclusion zone is still in effect.
The point of the story is that if ArcGIS was around at the time, they could’ve run the buffer geoprocessing tool. Since the blast, satellites like SPOT have been monitoring the Chernobyl exclusion zone because of its restrictions.
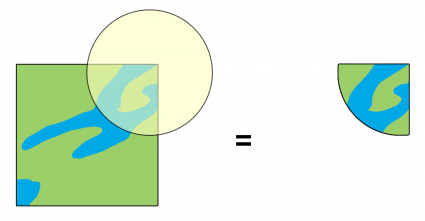
2. The Clip Tool
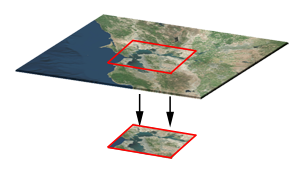
The clip tool is an overlay function that cuts out an input layer to the extent of a defined feature boundary. The result of this tool is a new clipped output layer.
If you can picture a cookie cutter, this is like using the clip tool. And carving out vectors and rasters is one of the most common operations in GIS.
To clip data, you need points, lines, or polygons as input and a polygon as the clipping extent. The preserved data is the result of a clip.
Clip Tool Example: Carving out Florida
Florida’s nickname is the “Sunshine State”. You can even find the Sunshine State on their license plate. But how much sunshine does Florida really receive?
It turns out that global horizontal irradiance (GHI) is a good measure of incoming solar radiation. So if you wanted to install a solar panel, GHI is the recommended data set.
If you clip GHI to the Florida state boundary, you can really find how much sunshine Florida really gets. When we clip GHI, we can add it to a map and even summarize the average GHI values.
3. The Merge Tool
The merge tool combines data sets that are the same data type (points, lines, or polygons). When you run the merge tool, the resulting data will be merged into one.
Similar to the clip tool, we use the merge tool regularly. For merging, data sets have to be the same type. For example, you can’t merge points and polygons into one data set.
Merge Tool Example: The Supermarket Merger
For example, if two grocery store giants like Ahold NV and Delhaize Group want to combine their 6,500 stores, we can use the merge tool.
In this case, we have two existing data sets from both companies. The merger between the two grocery stores into one company – Ahold Delhaize – means all grocery stores will be combined into a single data set. When you combine grocery stores (points) from both companies, they all end up in a final data set.
How is merging different to append? The append tool means you’re adding data to an existing data set. But merging means you’re taking two existing data sets and combining them to create a new merged data set.
4. The Dissolve Tool
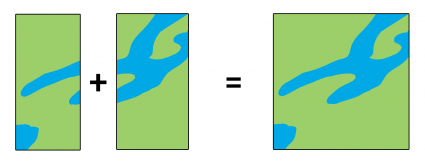
The dissolve tool unifies boundaries based on common attribute values. In other words, dissolve merges neighboring boundaries if the neighbors have the same attributes.
For example, if you want to remove the borders of countries to form a continent, the dissolve tool is the tool to use. But you would need an attribute for each country and the continent it belongs to.
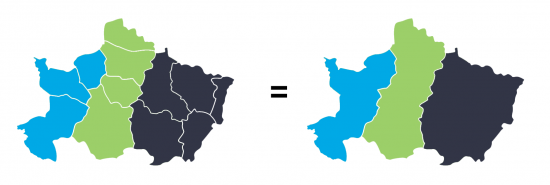
Dissolve Tool Example: Unifying Countries
What do Germany, Yemen, Tanzania, and Vietnam all share in common? They are all examples of two countries dissolving their borders and unifying to form one. Country unification is a rare event. But dissolving boundaries in GIS is not.
West Germany + East Germany = Germany
North Vietnam + South Vietnam = Vietnam
The dissolve geoprocessing tool erases borders and unifies them into one. When each country has its continent name in the attribute table, you can run the dissolve tool to unify borders into continents.
Over 25 years ago, the Berlin Wall was wiped away which divided East and West. The East and West dissolved their walls into a single country.
5. The Intersect Tool
The intersect tool is very similar to the clip tool because the extents of input features define the output. The only exception is that it preserves attributes from all the data sets that overlap each other in the output.
The intersect tool performs a geometric overlap. All features that overlap in all layers will be part of the output feature class – attributes preserved.
Add multiple inputs. The tool accepts different data types (points, lines, and polygons). When features overlap each other, they will be in the output. The intersect tool preserves the attribute values in both input layers.
PRO TIP: Run the Intersect Tool on a single feature and you can find overlaps.
Intersect Tool Example: Generating Pivot Tables
The city councilor asked the GIS analyst: “How many apartments, condos, and houses do we have in precincts A, B and C? Create a pivot table for me.”
Instead of running a clip, it would be helpful to run an intersect. Why? Because we preserve attributes from both input data sets. You need the building type from the dwelling layer. You need the precinct ID from the residential layer.
When you run the Intersect Tool with the dwellings and residential layers, the output will have all the points that overlap for each precinct. Most importantly, it will keep the dwelling type AND precinct ID.
Select all the rows. Click Ctrl-C in ArcGIS, then click Ctrl-V in Excel. In Excel, select all the cells from your tables and insert a pivot table.
What’s the difference between the clip tool and the intersect tool?” The main difference is the resulting attributes. When you run the clip tool, only the input features attributes will be in the output. When you use the intersect tool, the attributes from all features will be in the output.
6. The Union Tool
Some say the union tool should come with a bottle of antacid. The union tool gets a bad reputation because it creates a lot of features. The union tool maintains all input feature boundaries and attributes in the output feature class.
After running this geoprocessing tool, it does get a bit messy especially when there are more overlaps. But it’s really not so bad. The Union tool spatially combines two data layers. It preserves features from both layers to the same extent.
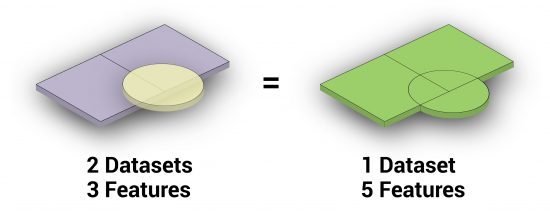
Union Tool Example: Basic Shapes
In this example, we have an overlapping circle and square. The circle is a single record and the square is a single record.
When you run a union on these two features, it produces 3 records – the original circle, the original square, and the overlapping portion.
Unions have been especially useful in suitability applications because you can understand where different habitat types overlap.
7. The Erase (Difference) Tool
I like the erase tool because it’s always helpful to erase things! The input layer is what will be erased. The erase feature determines what to erase. Simple as that.
The Erase Tool removes features that overlap the erase features. This geoprocessing tool maintains portions of input features falling outside the erase features extent. The result is a new feature with the erase feature extent removed.
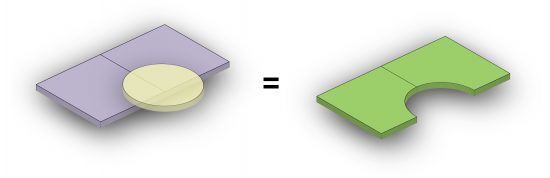
Erase Tool Example: Erasing Forest Burns
Humans start 90% of wildfires. Lightning strikes the Earth 100,000 times a day. 10 to 20% of these lightning strikes can cause forest fires.
No matter how you slice it, forest fires are happening at all times somewhere on Earth. Ecologists need to understand how much suitable habitat exists on the landscape.
When a forest fire tears through a forest, you can run the erase tool because these forest stands no longer exist. They are no longer suitable habitats for certain species. Erase those areas with the wildfire polygons and BOOM, you have an updated habitat extent.
You’re Ready to Take the Geoprocessing Training Wheels Off
We’ve sifted through the big 7 geoprocessing tools.
These are so common that ArcGIS and QGIS have added them to drop-down menus for easy access.
When you learn these 7 geoprocessing tools, you develop a good baseline of GIS skills. On top of that, you are one step closer to becoming a GIS guru.
But in reality, there are thousands of geoprocessing tools. Our GIS analysis section is a good place to start. Also, you check out Esri’s Spatial Analysis Map for more real-world examples of GIS Processing.
The comments section is below. Let me know.


I feel gratified.
The buffer tool is generally basic and easily applicable. There are other tools that can be used to calculate or see within a specified distance.
To cut the area of an overlapping shape file you could use the erase tool or select features by attributes. That way you only get the features you need.
I hope this helps!
Thanks very much
Thank you
Thanks for these information.
I would add a tool that computes distance (near, spatial join, generate near table)
and the summary statistics tool. ( I rarely use union since it only works with polygons and I often have questions about points/lines/polygon layers).
Also the Intersect tool is the go-to tool for adjacency and overlap questions such as, find the location to boat to on a river to access the border between spruce and willow polygons, find the largest repeat burn area over the past 30 years, etc.
Sorry if this is really simple and stupid but could anyone explain how to cut the area of an overlapping shape file.
For example I have a field with a track running through it. The field is one shape file the track is another shape file overlaying the field. How can I cut the track from the field to show the background mapping data. (without manually having to cut around the shape)
Huge thanks to any answers!
Two polygons I assume? If so, you can use the ‘erase’ tool. You’d use the outside track (larger one) as the input feature. The inside of the track (smaller one) would be erase feature. After running the tool, you’ll only have the track remaining, which is what I think you are after.
If you have polylines, they can always be converted to polygons.
Hope this helps, let me know if I misunderstood
Yes, buffer is hardly the answer to everything, but it is the answer to many things. Homogenous distance offsets are a common feature in the planning world: Natural stream buffers, frontage and sideyard setbacks, distances from schools or churches for alcohol permits. As Kimo noted, it would generally find less use in modeling natural phenomenon such as fall out plumes, or flood zones. It’s another tool for the toolbox, and quite a useful one.
Agree with “kimo” but it is nonetheless useful in city planning where, for example you have defined an area of maximum commute by a certain residential area to come up with the best location for a school…..but yes there is huge randomness in case of natural “stances” which is absurd to deal with any geometrical buffering…
I think your description of Buffer is far too simple and should not be promoted as the first essential tool. It is often used completely inappropriately as you have for Chernobyl.
All natural buffers are irregular and dependent on other environmental factors. So the fallout around Chernobyl is a plume with a bias downwind, not a perfect circle. Floods follow contours and have surges, not a fixed distance from a centreline or low flow bank. The river surface has a slope not modelled with a buffer. Pollution seeps through the ground depending of the soil and groundwater flows. Even sound has an irregular profile.
I tell my students ‘Never Use a Buffer” because it is certain to be wrong or at the very best inappropriate. It should be removed from the top of all introductory texts as the essential spatial tool. Just because it looks pretty is not a good reason to use it as an exercise. There are plenty of tools that model spatial influences better than a buffer so we should be careful to teach them from the start.