The Power of Spatial Analysis: Patterns in Geography

The Power of Spatial Analysis: Patterns in Geography
Spatial analysis solves location problems basically using math in maps. It blends geography with modern technology to measure, quantify, and understand our world.
But here’s the twist:
Whether you’re aware of it or not, you’ve probably used spatial analysis today.
And despite its strong ties with computing (namely GIS), spatial analysis has been in use since as late as 1854.
More on that later. But first, let’s dive into some spatial analysis examples.
What can spatial analysis and cannot do?
Geographic Information Systems (GIS) uses spatial analysis. What GIS does is connect geography with the real world. It puts points on a map to see how everything is related.
But it’s more than that:
By studying their topological, geometric, and geographic properties, we can uncover patterns we’ve never seen before. This is spatial analysis!
Here are some examples of spatial analysis:
Where can you find land features?
- Routing can show you the quickest path.
- Optimal location analysis can find the most suitable location to build with network analysis.
What’s their relationship?
- Area calculations can quantify the size of a forest fire.
- Distance measurements estimate how far anything is.
What geographical patterns exist?
- Hot spot analysis highlights high rates of crime in a city.
- Regression models determine what habitats animals select and avoid.
How does geography change over time?
- Land cover change shows the extent of human development.
- The geographic mean center displays trends in population shifts in time.
So overall, spatial analysis can quantify, find patterns, and predict outcomes using the geography of our world. Then, we can take action and make informed decisions based on it.
How do you use spatial analysis?
Whether John Snow realized it or not, his findings marked a major milestone for spatial analysis.
It was just a basic overlay procedure, but it resonated by saving the lives of thousands.
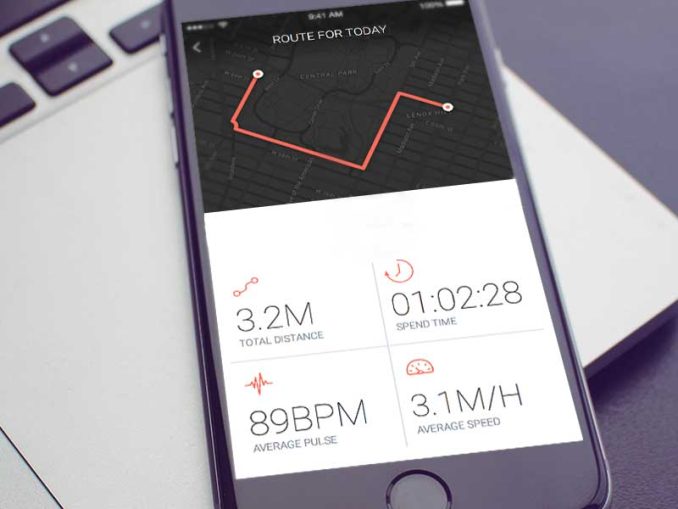
To this day, we use the products of spatial analysis. You may not even know, but we harness the power of spatial analysis in our daily routines. For example, GPS in our phones pinpoints where we need to go. And weather forecasts deliver real-time predictions.
Just think about it for a second:
Some of the biggest challenges we have to tackle today are spatial in nature – climate change, natural disasters, and population dynamics.
For centuries, maps have stood the test of time. Viewing our world on a map impacts how we see it. But spatial analysis gives us the power to quantify and act.
Tools in the spatial analysis toolbelt
In GIS, there’s nothing more important than having the right geoprocessing tools available for you. Here are the top ten geoprocessing tools that are like our bread and butter:
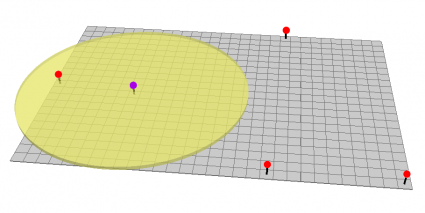
- Buffer tool – Generates a polygon around features at a set distance.
- Clip tool – Cuts out an input layer to a defined feature boundary.
- Merge tool – Combines data from multiple sources, then adds them into a new data set.
- Dissolve tool – Unifies adjacent boundaries based on common attribute values.
- Intersect tool – Performs a geometric overlap with all overlapping features becoming part of the output feature class.
- Union tool – Combines input data layers into a single composite layer, preserving the boundaries and attributes from all input features.
- Erase tool – Removes the area that is overlapping with the erasing features.
- Append tool – Adds data from one or more sources and puts it into an existing target data set.
- Spatial join – Inserts the columns from one feature table to another based on location or proximity.
- Relate/Join – Matches unique IDs in two tables, and creates a table by relating or joining.
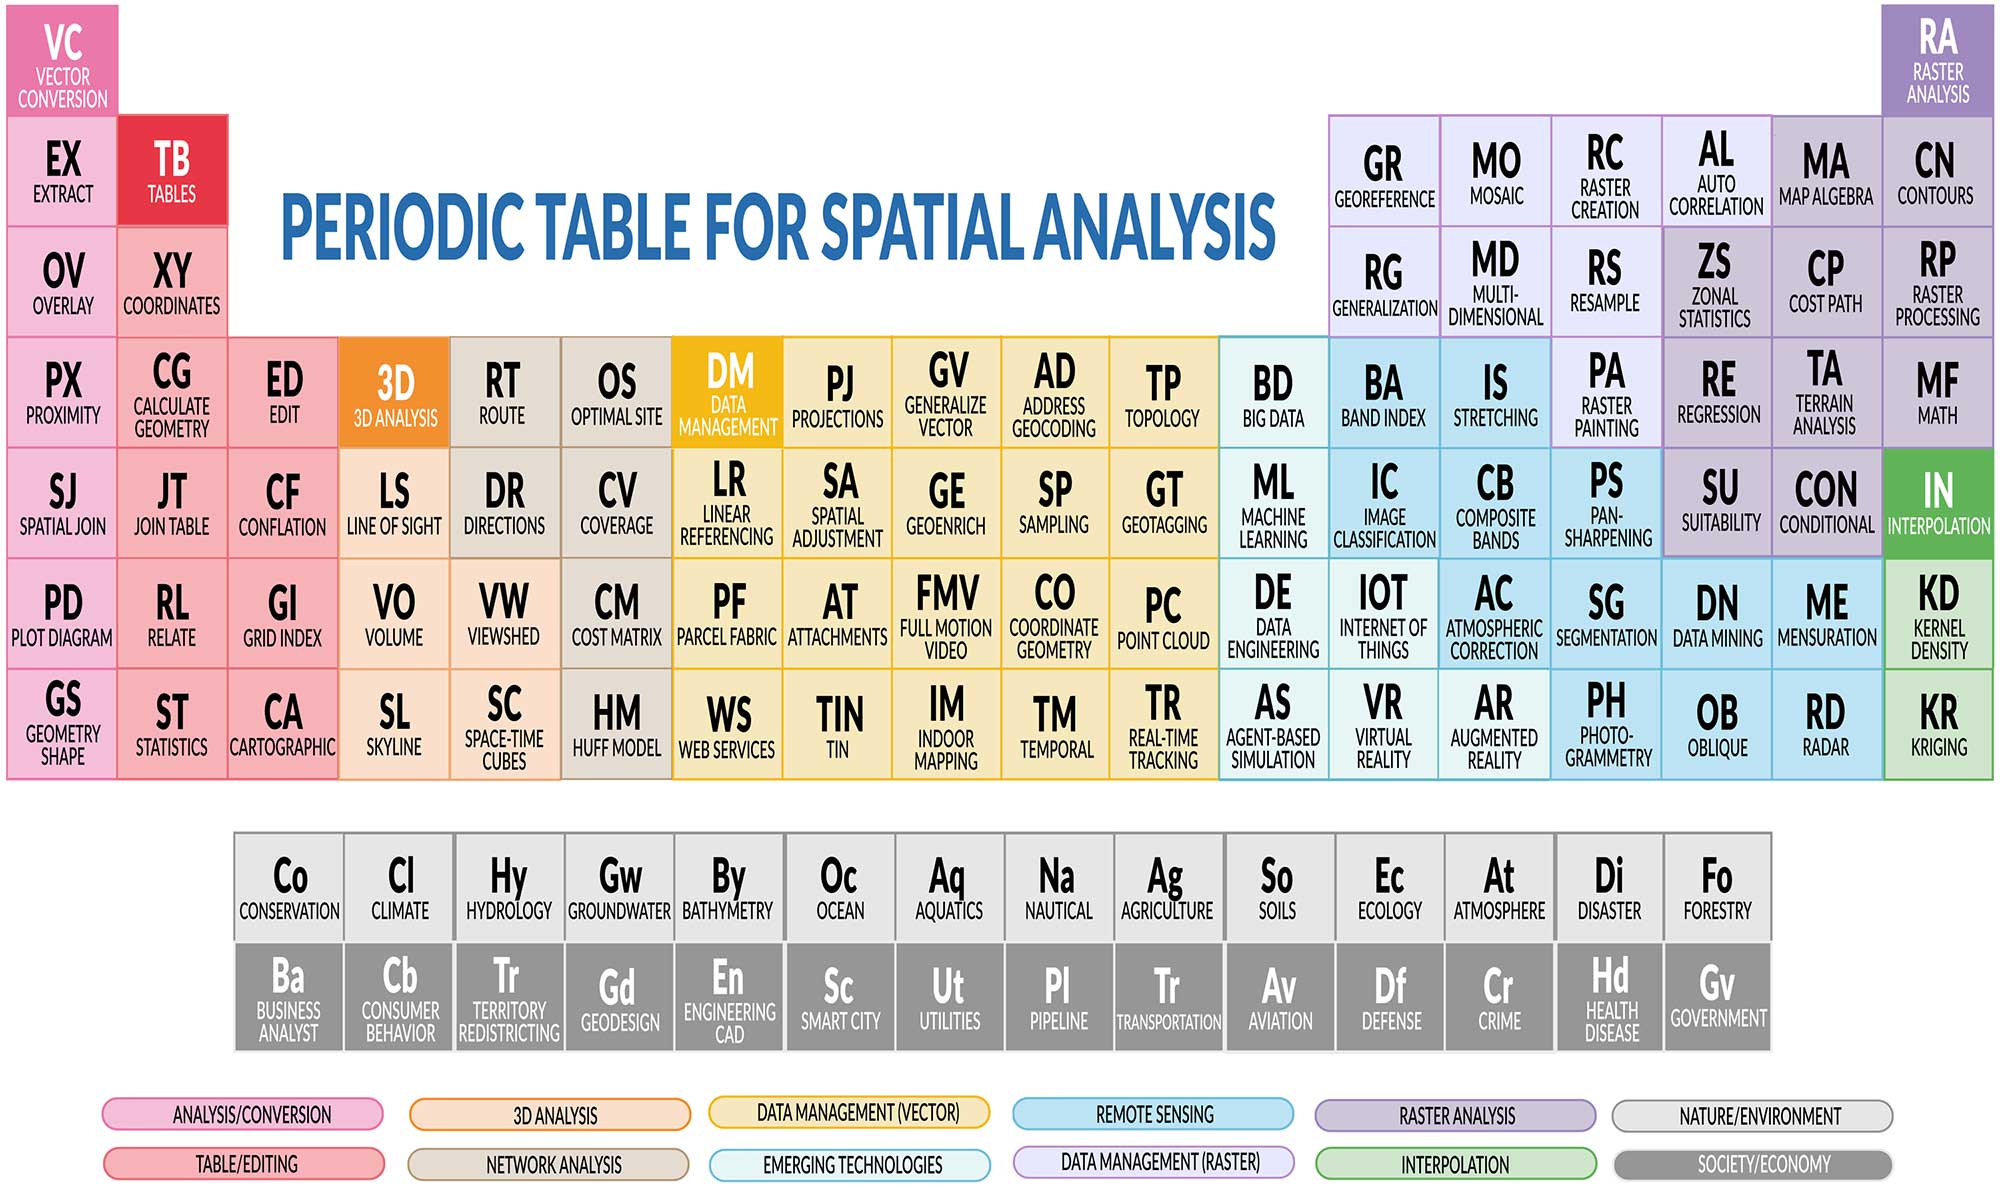
If you want a thorough outline of geospatial analysis, then make sure to check out our Periodic Table for Spatial Analysis (as shown below).
John Snow Cholera: The Birth of Spatial Analysis
At the age of 41, John Snow faced the greatest challenge of his life. Cholera broke out in Soho, England. It was absolutely devastating. Residents were dying on the street. The symptoms of cholera were gruesome. John Snow knew he was fighting an uphill battle.
During the outbreak, there were two beliefs about how cholera spread. (1) Air pollution was the cause. (2) And those who were skeptics of it. John Snow belonged to the second party. But he needed to prove why cholera didn’t circulate through the air.
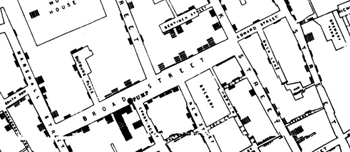
The good thing was that he was an analytical thinker. So he could improvise in an inventive way. With his trusty map in hand, John started plotting cholera cases, water lines, and pumping stations.
That’s when it all clicked. The answer was in front of his eyes. By using map overlays with the city’s drinking water supply with cholera cases, he used spatial analysis to understand their geographic relationship. Thus, he traced the source to a contaminated water pump.
During the cholera outbreak, 616 people died in total. But it could’ve been worse. John Snow was always considered a leader in anesthesia and medical hygiene. But now, he has become the founding father of a whole new field of study – epidemiology.
Maps always tell a story. Oddly enough, John Snow is never considered a pioneer of spatial analysis. But he really should be.


John Snow’s work was intriguing because he used maps to solve a medical situation showing that where people lived and got their water explained how the sickness was spreading
There’s a typo in the name of the first slide
Analsys – analysis
Thanks, you’ve got a sharp eye. I fixed the typo.