GIS Day is on Wednesday, November 19, 2025
Are you excited about GIS Day? People from around the world celebrate GIS Day. In 2025, it’s scheduled for Wednesday, November 19, 2025.
Are you excited about GIS Day? People from around the world celebrate GIS Day. In 2025, it’s scheduled for Wednesday, November 19, 2025.
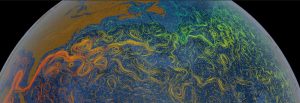
Our ocean’s movements push large amounts of water every day. But where? See this list of ocean currents map and visualize our oceans movement and dynamics.
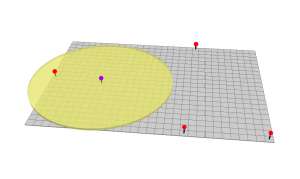
The buffer tool (planar/geodesic) generates a polygon around features at a set distance. Here are ring, geodesic & euclidean buffers.

Routing, mapping and LiDAR. Will GIS thrive in a world of driverless cars? We explore the potential integration of GIS in autonomous vehicles.
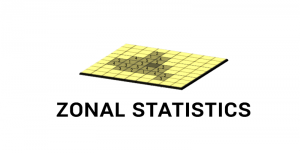
Zonal Statistics uses groupings to calculate statistics (sum, mean, maximum, etc) for specified zones like countries, watersheds or parcels.

We list geocoding and reverse geocoding services that are available (for free and as paid services) to pinpoint addresses on your maps.

Have you ever wanted to look deep into the ocean and see its topography? Turns out, you actually can with this list of ocean bathymetry data.
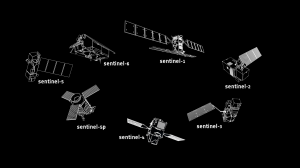
Copernicus is the world’s largest and most ambitious Earth observation program in existence today with its Sentinel satellites taking center stage.
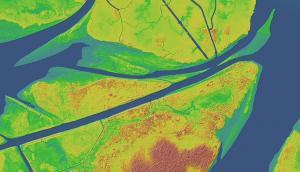
This tutorial explains how to read point clouds (LAS files) with ArcGIS 3D Analyst and build a digital elevation model and surface model.
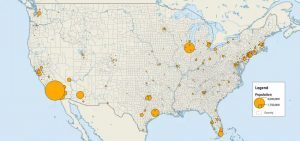
While graduated symbols and proportional symbols scale the size of the symbol based on value, dot distribution maps use dots for quantity.