How To Use Zonal Statistics
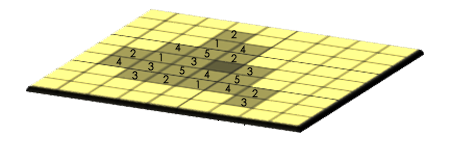
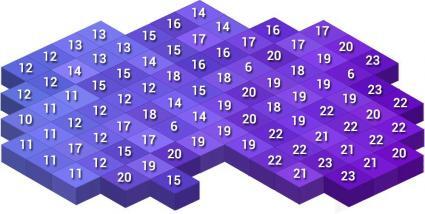
Zonal Statistics uses groupings to calculate statistics within specified zones.
For example, you can calculate everything from mean, median, sum, minimum, maximum, or range in each zone.
The zonal extent could include anything from country boundaries, watershed catchment areas, or property parcels as a vector or raster dataset. But the dataset in which you calculate a statistic must be raster.
Examples of Using Zonal Statistics
Zonal Statistics is a common spatial analysis procedure for raster data. Here are some examples of when you would use this operation in GIS:
- Summarizing Rain in a Watershed – If you want to find out how much rain is in a watershed, you can use a zonal operation like this one. By using a precipitation raster as your value field, you can set your zone as the watersheds with a sum function.
- Highest Elevation in Country – If you have an elevation raster dataset, you can run Zonal Statistics to find out its highest peak by using the maximum function.
- Adding Tree Cover in an Ecozone – To find the tree cover area in an ecozone, you can run Zonal Statistics, to sum up, a raster land cover dataset.
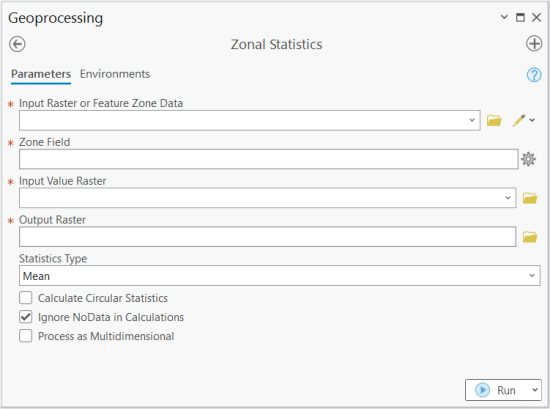
How To Use the Zonal Statistics Tool
In ArcGIS, there are two main tools to run this process:
Zonal Statistics – Outputs a raster defined by your zones and input value raster.
Zonal Statistics as Table – Generates a summary table based on the specified input value raster, statistical function, and zonal extents.
To add the output table back into your input zones, you will have to first use the join table operation. Then, you can copy the statistical field over by matching it with the same zone field.
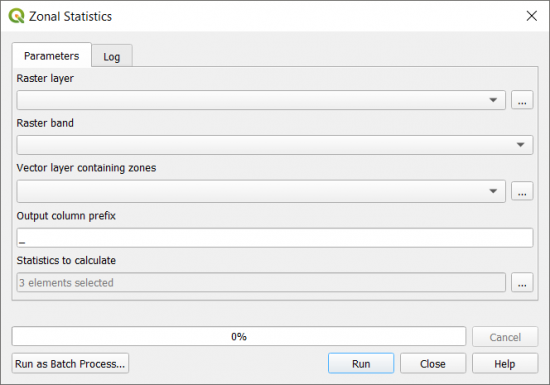
In QGIS 3, this tool is part of the Raster Analysis Toolbox. The main difference between ArcGIS is how it adds a field directly into the zonal input table.
Either way (ArcGIS or QGIS), both tools allow you to perform zonal statistics in a GIS system.
Error Troubleshooting
Some of the common errors that accompany this tool are related to:
- Number of Zones – Having in excess of 170,000 features as zones.
- Output File Type – The Esri Grid file format has limitations, so GeoTIFF is the recommended GIS file format for output.
- Large Input Files – If you receive the 999999 error code, it’s likely because the file size is too large. Also, check your file name and geodatabase path for any unacceptable characters.
If the operation completely fails, then this can be related to your zonal raster input missing an attribute table.
There have also been issues working with decimals. If you have decimal values, you can multiply your input raster values by one hundred. Afterward, you can convert your raster to an integer using the int tool. After you run Zonal Statistics, you can then divide your data by one hundred to put it back in its original format.
Summary: What Is Zonal Statistics?
Zonal statistics is an analytical tool specifically for raster datasets. It enables you to calculate statistics like the average, sum, minimum, or maximum in defined zones.
It also works for vector zones, but the input value has to be an acceptable raster file format.
Do you have any troubleshooting questions or anything to add? Then, check out our comments section below.
Zonal statistics performs a summary calculation, such as mean or maximum, for a defined boundary.


