Global Forest Maps to See the Forest for the Trees
Global Forest Maps
Forests cover about 30% of the Earth’s surface. Over 1 billion people depend on these forests for their survival because it’s their pharmacy, their fuel, and food for their animals.
Forests keep rivers clean. They prevent soil erosion and prevent landslides and avalanches. Plus, they are carbon sinks because they absorb over one-fifth of carbon emissions caused by fossil fuels.
But forests are disappearing.
Natural causes like disease and forest fires have always existed. Human activities are now the leading cause of deforestation. No other human activity has caused more deforestation than animal agriculture.
We have a better spatial understanding because of satellite and mapping technologies. These 4 global forest maps tell a story of our trees. So let’s take a look and start seeing the forest for the trees.
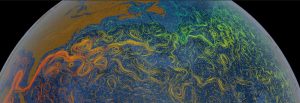
1. NASA’s Forest Heights Map
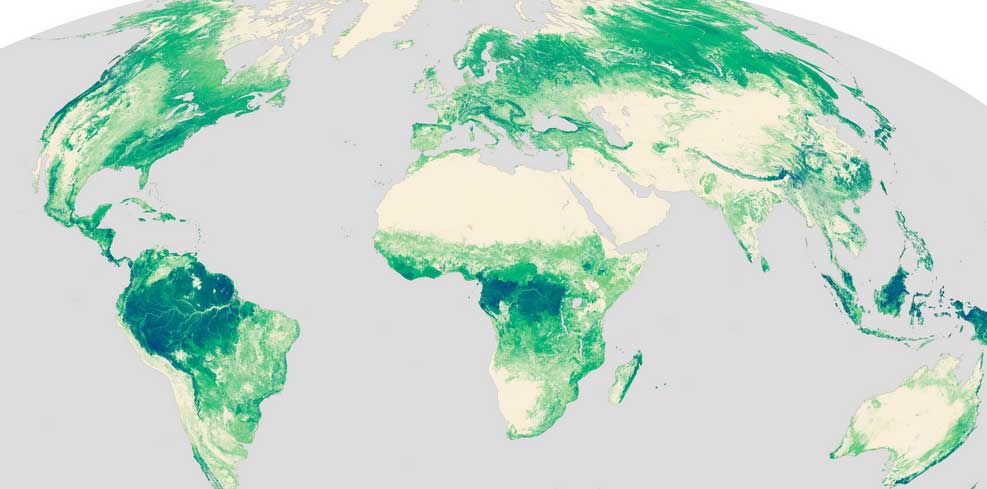
NASA’s Forest Canopy Height map is a first of its kind. It’s unique because it shows the height of trees on the entire planet.
Now, NASA didn’t go out in the field and measure every tree height to make this forest map.
So how did they do it?
All tree heights were derived using satellites orbiting our Earth such as Geoscience Laser Altimeter Systems (GLAS). GLAS is a laser-ranging technology. It sends a pulse and measures how long it takes to return to get distance. But GLAS wasn’t the only satellite NASA used. It combines the Shuttle Radar Topography Mission (SRTM), MODIS, TRMM and the WorldClim databases.
Have you noticed how tree heights are generally taller at the equator?
Some trees tower higher than 40 meters in height at the equator. At the poles, the tree canopy is generally shorter. Countries in northern Europe, Canada, and Russia tend to have tree canopy heights of less than 20 meters.
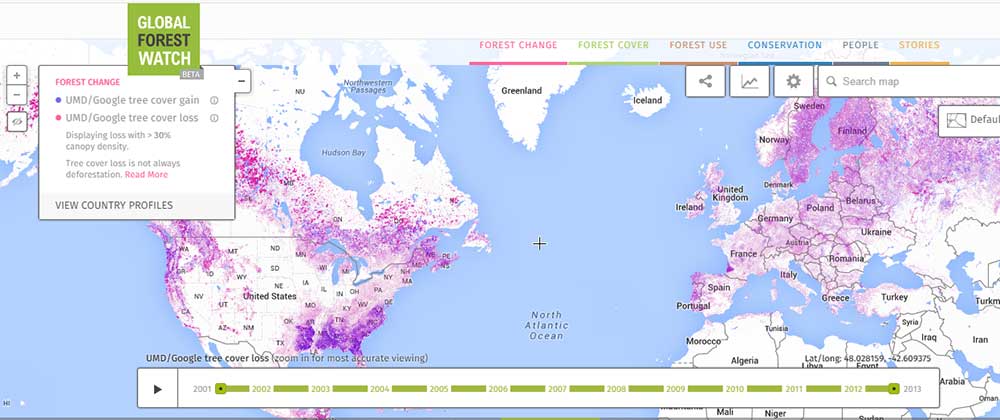
2. Global Forest Change
Almost one-third of our land is covered in forests. But deforestation is cutting down our forests to about the size of Greece per year. That’s 50 soccer fields every minute.
The effects of deforestation are devastating. It increases greenhouse gases and soil erosion. It takes away habitat for wildlife and homes for indigenous groups.
How can we quantify deforestation?
Landsat is the reigning monarch of historic satellite data. 40 years and counting! Landsat is the longest-running Earth observation mission in history. We could compare a snapshot of Earth from 1972 using Landsat-1 data if we really wanted to.
The University of Maryland has carved out the drool-worthy Global Forest Change map solely using Landsat data. The key focus is forest extent and change. “Forest” is defined as vegetation taller than 5 meters. Forest cover loss and gain are highlighted from 2000-2012.
We knew there were red flags for countries like Indonesia, Honduras, and the Philippines and deforestation. On the map, they look like signal flares! Global forest maps like these confirm reports and statistics about how these countries sustained great losses in forests.
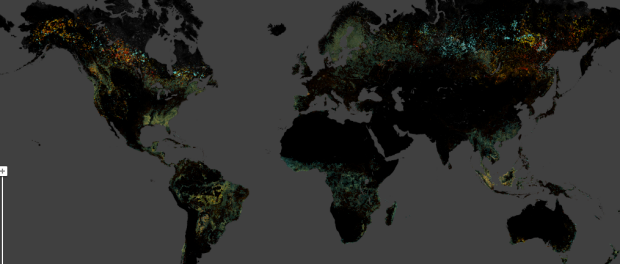
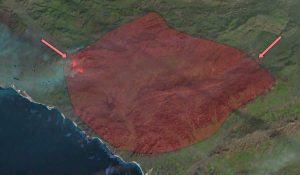
3. NASA Forest Fires
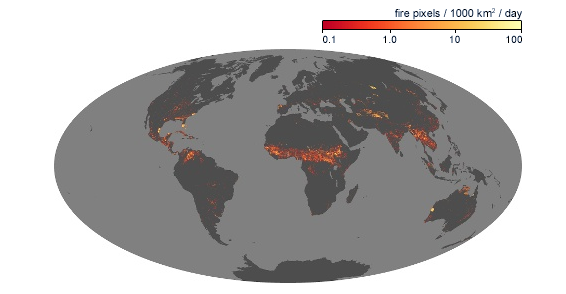
When there’s smoke, there’s fire. And on Earth, there’s something always burning. NASA’s Moderate Resolution Imaging Spectroradiometer (MODIS) keeps a close eye on wildfires around the globe.
Whether they’re started by people, lightning strikes or by other means, NASA’s fire maps pinpoint locations of actively burning fires.
Are forest fires harmful to the environment?
Forest fires are not necessarily bad. They can clear dead underbrush and restore it to good health. In certain ecosystems, plants require periodic burning to reproduce.
NASA’s fire maps are animated dating back to 2000 all the way to this year. It’s unbelievable watching the time series animation and watching the flames roar on our planet.
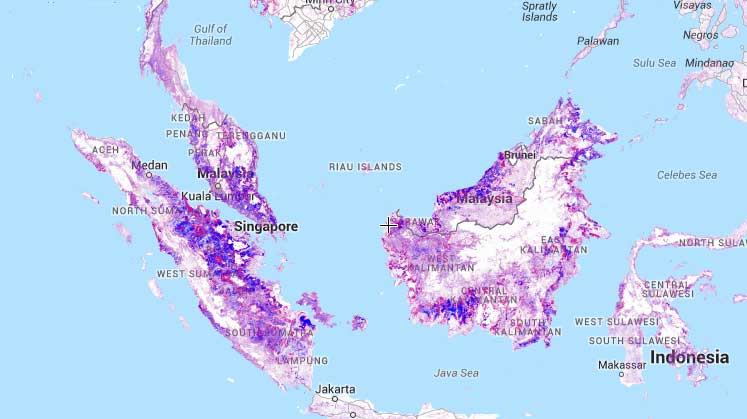
4. Global Forest Watch
Global Forest Watch is really the mother of all forest monitoring websites. It’s not just one map; it’s a series of forest maps. Each one has cutting-edge algorithms harnessing the power of satellite data and cloud computing.
The more you think of it, there’s a lot we don’t know about forests like:
- Where are we clearing forests?
- Why does it happen?
- And who is responsible?
Users can dynamically view Landsat’s forest gain/loss data in near real-time. Global Forest Watch takes it a step further showing how forests are being used such as palm oil, mining, logging, etc. It has time animations, forest fire data, and conservation areas.
It’s free and simple to use. Governments, businesses, academics, media, and NGOs can gain a wealth of information and ensure sustainability. Global Forest Watch really lets you sit in the driver’s seat and openly explore a goldmine of forest maps and information.
Forest maps mean action
If an old tree falls in the forest and nobody’s around to hear it, does it make a sound?
Near real-time satellite imagery has transformed our global understanding of forests. Satellites deliver timely and accurate information about forest fires, deforestation, canopy height, and even forest disease.
Forest maps give users the power to stop harmful forest loss. For example, business managers buying commodities such as palm oil can use near real-time forest maps to see if suppliers are clearing forests they committed to protect.
This technology empowers people everywhere to better manage forests.
…so if an old tree falls in the forest and nobody’s around to hear it, does it make a sound? With these global forest maps, everyone hears it.


This is a good initiative.
It gives clear insight on the status of our forests globally and also energizes us to continue with the restoration as well as conserving the available forests.
https://www.eorc.jaxa.jp/ALOS/en/index_e.htm
Here’s more one initiative with SAR data.
Global forest map is not only depicting facts of forests, but it alarming environmental crisis to the next generations..
Here’s a reference for GLAS precision – https://nsidc.org/data/gla01/versions/33
For GLAS laser, what is the accuracy and reliability of height above ground? Can we expect it to be as good as LIDAR?