Point Clustering in ArcGIS Pro
Point clustering groups nearby points into clusters. This makes it easier to interpret a high density of points and clearer to read. You can also spot trends and patterns by clustering points
In this article, we’re going to show you how to use point clustering in ArcGIS Pro. You’ll also learn some of the beginners of point clustering.
How To Perform Point Clustering in ArcGIS Pro
The first step is to add your point layer to ArcGIS Pro. Unfortunately, you can’t use lines or polygons yet for this tool.
After you add your point data, click on your layer in the table of contents. Next, click on the “Feature Layer” ribbon at the top. Finally, select the “Aggregation” dropdown and choose “Clustering”.
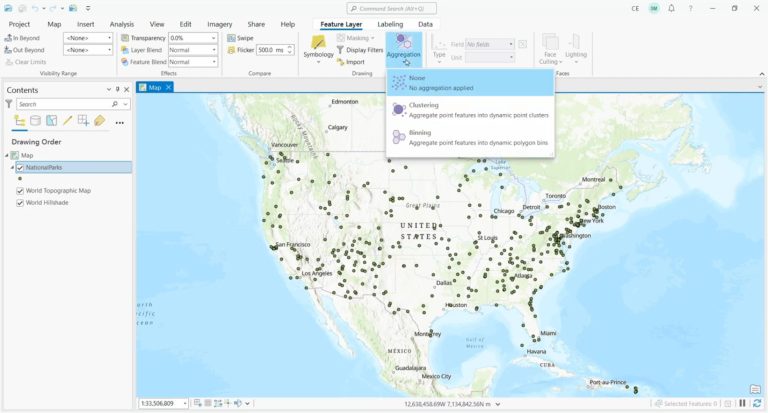
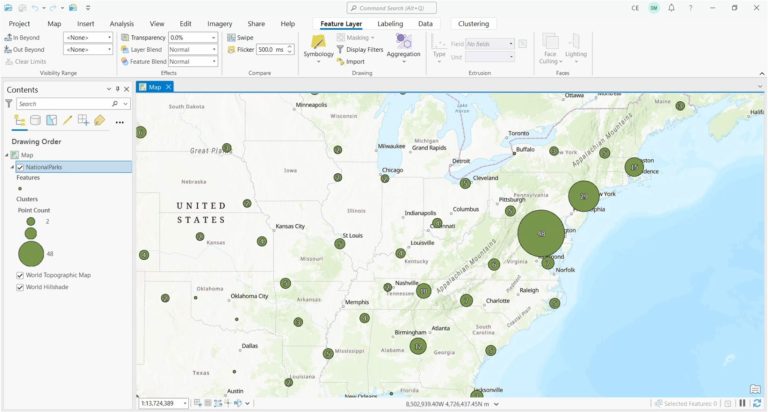
This will generate circles of different sizes in your map. For a high density of points, it will represent them as a larger clustered point. But for a low density of points, circle sizes will be smaller. As you zoom in and out, it resizes each cluster point.
What are the benefits of cluster mapping
What is cluster data used for? From urban planning to crime prevention, here are some examples of cluster mapping in GIS:
- Urban Planning: Identifying areas with high concentrations of traffic accidents to improve road safety.
- Crime Hotspots: By clustering reported incidents, police officials can see where crimes are concentrated.
- Environmental Studies: Spotting regions with significant deforestation or wildlife clusters for conservation efforts.
- Public Health: Tracking disease outbreaks by clustering reported cases, helping to manage and prevent spread.
- Retail Business: Analyzing customer locations to decide where to open new stores or offer targeted promotions.
These examples show how cluster mapping in GIS supports various fields by making data easier to understand and act upon.
Summary: Cluster Mapping
Cluster mapping aggregates points, making it easier to read. This method is very useful because it helps us spot trends. For example, by clustering points, we can quickly identify which parts have traffic congestion.
While point clustering simplifies data visualization, it also retains important information. Point clustering helps decision-makers understand data at a glance.
We’d love to know how to use point clustering or any of the other aggregation tools. Please add your questions or comments in the form below and add to the conversation.


