uDig – User-friendly Desktop Internet GIS (Review)
What is uDig?
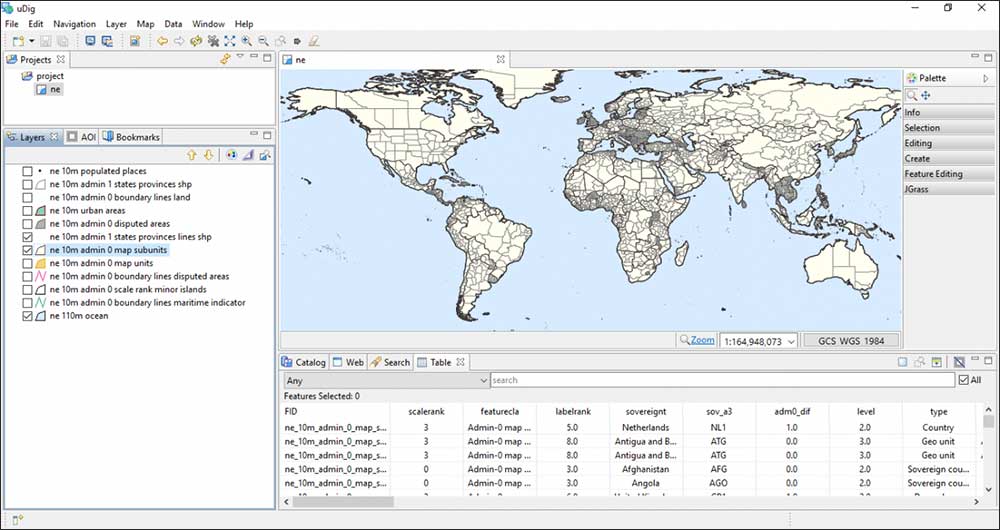
uDig (User-friendly Desktop Internet GIS) was developed by Refractions Research. Refractions are the developer and maintainer of not only uDig but PostGIS – a standard open source spatial database.
While uDig is a working open-source, Java-based, desktop GIS application, it is also an open source GIS development platform. Volunteers worldwide continue to develop this open source desktop application. Focus is placed on database viewing and editing as well as a rich collection of GIS functionality.
Pros/Cons of uDig
Here are some of the advantages and disadvantages of using uDig compared to other GIS software applications.
PROS
CONS
Rankings
Mapping
Analysis
Editing
Data Support
Ranked #27 from 30 GIS Software
The uDiG Acronym
The uDig acronym means the following:
- “u” stands for user-friendly interface
- “D” stands for desktop (Windows, Mac or Linux). You can run uDIG on a Mac
- “I” stands for internet-oriented consuming standard (WMS, WFS or WPS)
- “G” stands for GIS-ready for complex analytical capabilities
On top of that, this application can be run on Windows, Linux, and Mac OS.
Drag and Drop Interface
When you start digging into uDig, it has all the fundamental tools you’d expect from mapping software.
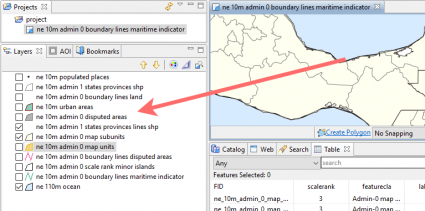
The drag-and-drop interface reassures its user-friendliness. It liked my shapefile… and GeoTIFF… but strangely not my KMZ.
You can manually add data through Layer > Add. This includes a number of formats such as ArcSDE, Oracle, DB2, and more.
It even offers capabilities to integrate Web mapping technologies, such as WMS, WFS, remote ArcSDE, WCS, GeoRSS, and KML.
Editing Tools
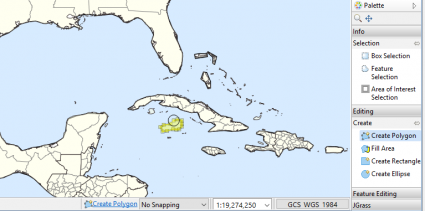
uDig is equipped with minimalist editing tools to get basic edits done. In the side panel editing tab, select the layer you want to edit. You can create features under the ‘Create’ tab.
Here I create another island next to Cuba and Jamaica.
You have the option to trim, merge, split, edit vertices, cut holes, and more.
Select Edit > Commit and Edit > Rollback for transactions in a server, database or file.
After adding your data, the Styled Layer Descriptor (SLD) is an XML document that helps define how features will be rendered on screen. You have options for printing and PDF generation.
Add Webmap Tiles from a Catalog
One of the neat things about uDig is that it has a catalog of web map tiles that are available as services. uDig’s Mapnik lets you import base maps. This means that you are a couple of steps away from having solid base maps added to your view.
To add a map tile service, click Layer > Add. Select the option from ‘Web Map Tiles’. You have a load of map tiles to choose from including OpenStreetMap, MapQuest and Bing.
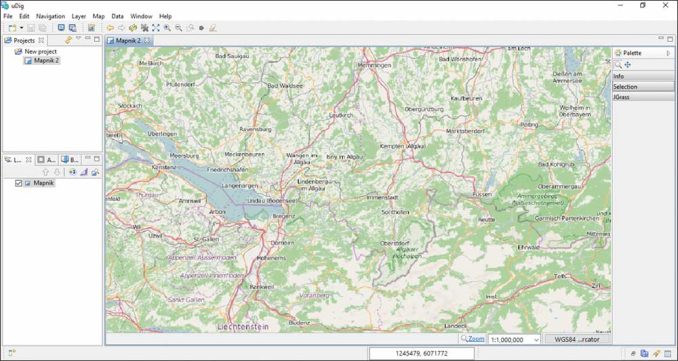
Alternatively, you can add your own custom map service. You can follow the same steps as above but instead select ‘Custom Server’ and specify the URL.
I found this a bit buggy at times.
The Spatial Toolbox
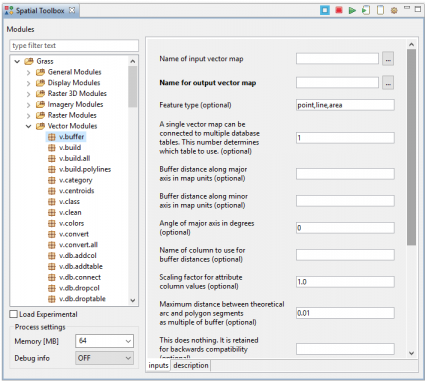
The spatial toolbox in uDig is not enabled by default. To enable the geoprocessing tools, click Window > Show View > Other > Spatial Toolbox.
You’ll also need to load the JGRASS toolbox. After a bit of effort and searching around, JAR files contain the GRASS modules.
After this is loaded, uDig now has the firepower for complex vector operations
It also embeds JGRASS and specialized hydrology tools from the Horton Machine. It supports shapefiles, PostGIS, WMS, and many other data sources natively.
Conclusion
uDig has been used as a framework for building other GIS platforms and applications including DIVA-GIS and DEWS (Distant Early Warning System for Tsunamis).
…And the Eclipse Rich Client Platform delivers a plug-in system for developers.
Overall, uDig doesn’t quite offer the complete package one would expect with QGIS or one of the premium commercial-grade software packages.
But it’s good for the basics… Strengths are user-friendliness, editing capabilities, and web comparability.

