13 Free GIS Software Options: Map the World in Open Source

Your search for free GIS software is now over
You don’t have to pay a king’s ransom to map the world. This is because you can do it all with free GIS software.
The best part is:
These free GIS software give you the firepower to get the job done as if you’re working with commercial GIS software.
We’ve ranked the top 30 GIS software applications. But these 13 reign supreme for free mapping software.
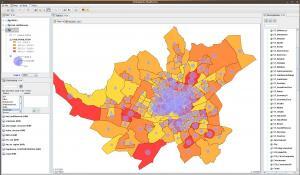
1. QGIS 3
4.8 stars
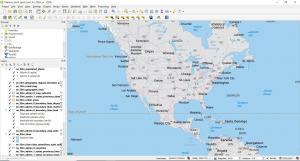
QGIS 4 coming soon?!? When QGIS releases a new version, it’s kinda a big deal. Because the unsung heroes of open source GIS software are back! It’s their third big release. QGIS 3!
Open source flows in the DNA of QGIS 3. It’s been genetically tailored to break the mold of commercial GIS. Not only because it’s now in 3D. But QGIS plugins still give you the power to analyze like the Incredible Hulk.
QGIS 3 is the most inventive release. For example, it brings a whole new set of cartography, 3D, and all its convenience worth its weight in gold. And it’s the only open source GIS software that can compete with ArcGIS Pro as shown in these 35 differences between ArcGIS Pro and QGIS 3.
2. GRASS GIS
3.9 stars
GRASS GIS (Geographic Resources Analysis Support System) was developed by the US Army Corps of Engineers as a tool for land management and environmental planning.
It has evolved into a free GIS software option for different areas of study. Academia, environment consultants, and government agencies (NASA, NOAA, USDA, and USGS) use GRASS GIS because of its intuitive GUI and its reliability.
It has over 350 rock-solid vector and raster manipulation tools. Not awfully useful in cartographic design, GRASS GIS excels primarily as a free GIS software option for analysis, image processing, digital terrain manipulation, and statistics.
REVIEW: GRASS GIS – Geographic Resources Analysis Support System Review
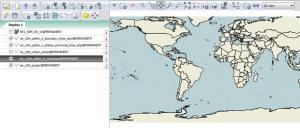
3. Whitebox GAT
3.8 stars
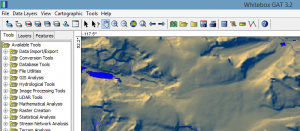
Yes, Whitebox GAT (Geospatial Analysis Toolbox) is #4 on the list of open source, free GIS software. Unbelievably, Whitebox GAT has only been around since 2009 because it feels so fine-tuned when you see it in action.
There’s a hydrology theme around Whitebox GAT. It actually replaced Terrain Analysis System (TAS) – a tool for hydro-geomorphic applications. Whitebox GAT is really a full-blown open-access GIS and remote sensing software package.
Where it shines is LIDAR! With no barriers, Whitebox GAT is the Swiss-army knife of LiDAR data. The LiDAR toolbox is a life-saver. For example, LAS to shapefile is an insanely useful tool. But you may need a Java update to go in full throttle though.
The cartographic mapping software tools are primitive compared to QGIS. But overall Whitebox GAT is solid with over 410 tools to clip, convert, analyze, manage, buffer, and extract geospatial information. I find it amazing this free GIS software almost goes unheard of in the GIS industry.
4. Birdi
3.6 stars
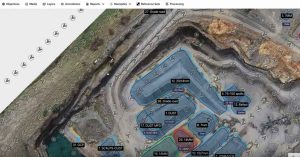
Just a caveat before I introduce Birdi. It’s not completely free per se. But it does offer an extremely generous free plan, which puts all your data in one central spot.
Birdi is perfect for inspections and reporting with a focus on drone operations. With a built‑in asset assessment, infrastructure teams use it for severity tracking. The platform also accepts different drone types and data… the most common ones at least.
But don’t expect this to be your traditional GIS software like QGIS. You won’t find advanced editing tools or even a geospatial processing. Instead, think of it as a centralized geospatial platform and you’ll be alright.
5. gVSIG
3.6 stars
After QGIS, gvSIG is the next best option for free GIS software. Its features are underrated. For example, it has a field app, 3D capabilities, and a desktop application.
Despite its lack of English documentation, the gvSIG project is still easy to pick up and work with. We illustrate in this gvSIG guide and review why we like it SO much.
- The NavTable is agile in that it allows you to see records one by one vertically.
- The CAD tools are impressive on gvSIG. Thanks to the OpenCAD Tools, you can trace geometries, edit vertices, snap and split lines, and polygons.
- If you need GIS on your mobile phone, gvSIG Mobile is perfect for field work because of its interface and GPS tools.
6. ILWIS
3.2 stars
Free GIS software users rejoice. Once commercial GIS software, now turned into open source GIS. ILWIS (Integrated Land and Water Information Management) is an oldie but a goodie.
The extinction-proof ILWIS is a free GIS software for planners, biologists, water managers, and geospatial users. ILWIS is good at the basics – digitizing, editing, and displaying geographic data. Further to this, it’s also used for remote sensing with tools for image classification, enhancements, and spectral band manipulation.
Over time, it has improved support for time series, 3 analysis, and animation. Overall, I found it difficult to do some of the basics like adding layers. However, the documentation is thorough with a pretty decent following for usage.
REVIEW: Integrated Land and Water Information Management (ILWIS) Review
7. SAGA GIS
3.1 stars
SAGA GIS (System for Automated Geoscientific Analyses) is one of the classics in the world of free GIS software. It started primarily for terrain analysis such as hillshading, watershed extraction, and visibility analysis. Now, SAGA GIS is a powerhouse because it delivers a fast-growing set of geoscientific methods to the geoscientific community.
Enable multiple windows to lay out all your analysis (map, histograms, scatter plots, attributes, etc). It provides both a user-friendly GUI and API. It’s not particularly useful in cartography but it’s a lifesaver in terrain analysis.
Closing gaps in raster data sets is easy. The morphometry tools are unique including the SAGA topographic wetness index and topographic position classification. If you have a DEM and don’t know what to do with it – you NEED to look at SAGA GIS. Overall, it’s quick, reliable and accurate. Consider SAGA GIS a prime choice for environmental modeling and other applications.
REVIEW: SAGA GIS (System for Automated Geoscientific Analyses) Review and Guide
8. GeoDa
3.0 stars
GeoDa is a free GIS software program primarily used to introduce new users to spatial data analysis. Its main functionality is data exploration in statistics.
One of the nicest things about it is how it comes with sample data for you to give a test drive. From simple box plots all the way to regression statistics, GeoDa has a complete arsenal of statistics to do nearly anything spatially.
Its user base is strong. For example, Harvard, MIT, and Cornell universities have embraced this free GIS software to serve as a gentle introduction to spatial analysis for non-GIS users. From economic development to health and real estate, it’s been used as an exciting analytical in labs as well.
9. MapWindow
2.6 stars
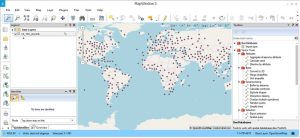
In 2000, MapWindow was proprietary GIS software. However, it has been made open through a contract with the US EPA called “Basins”. At this point, The source code was released to the public.
Now that MapWindow 5 has been released, it surprisingly has some serious punch. For example, MapWindow does about 90% of what GIS users need – map viewer, identify features, processing tools, and print layout.
It has some higher-level tools such as TauDEM for automatic watershed delineation. While HydroDesktop for data discovery, download, visualization, and editing, DotSpatial for GIS programmers. Also, it has an extensible plugin architecture for customization.
10. uDig
2.5 stars
uDIG is an acronym to help get a better understanding of what this Free GIS software is all about.
When you start digging into uDig, it’s a nice open source GIS software option for basic mapping. uDig’s Mapnik lets you import base maps with the same tune as ArcGIS
- u stands for user-friendly interface
- D stands for desktop (Windows, Mac, or Linux). You can run uDIG on a Mac.
- I stand for internet-oriented consuming standards (WMS, WFS, or WPS)
- G stands for GIS-ready for complex analytical capabilities.
Specifically, it’s easy to use, and the catalog, symbology, and Mac OS functionality are some of the strong points. But it has limited tools and the bugs bog it down to really utilize it as a truly complete free GIS software package.
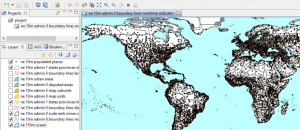
11. OpenJump
2.4 stars
Formerly JUMP GIS, OpenJump GIS (JAVA Unified Mapping Platform) started as a first-class conflation project. It succeeded. But eventually grew into something much bigger. Because of how its large community effort grew, OpenJUMP into a more complete free GIS software package.
One of its strengths is how it handles large data sets well. Rendering is above grade with a whole slew of mapping options. For example, you can generate pie charts, plotting, and choropleth maps.
OpenJUMP GIS Plugins enhance its capabilities. There are plugins for editing, raster, printing, web processing, spatial analysis, GPS, and databases. Conflating data is another option with a whole lot more from its plugins.
REVIEW: OpenJUMP GIS Software Review
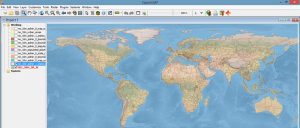
12. FalconView
2.1 stars
The initial purpose of FalconView is to be a free and open source GIS software. Georgia Tech built this open software for displaying various types of maps and geographically referenced overlays.
Now, most of FalconView’s users are from the US Department of Defense and other National Geospatial-Intelligence Agencies. This is because it can be used for combat flight planning.
In SkyView mode, you can fly through even using MXD files. It supports various types of displays like elevation, satellite, LiDAR, KMZ, and MrSID.
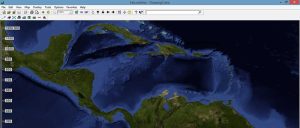
13. OrbisGIS
1.9 stars
OrbisGIS is a work in progress. Its goal is to be a cross-platform open source GIS software package designed by and for research. It provides some GIS techniques to manage and share spatial data. OrbisGIS can process vector and raster data models.
It can execute processes like noise maps or hydrology processes without any add-ons. Orbis GIS Plug-ins are available but are very limited for the time being.
The developers are still working on the documentation. You may want to look elsewhere until this project gets sturdy up on its feet.
14. Diva GIS
1.5 stars
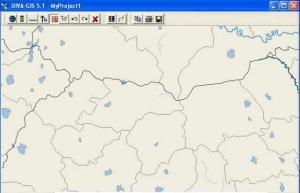
Biologists using GIS unite! This one specializes in mapping biological richness and diversity distribution including DNA data.
Diva GIS is another free GIS software package for mapping and analyzing data. Here’s some useful, everyday free GIS data for your mapping needs.
It’s possible to extract climate data for all locations on the land. From here, there are statistical analysis and modeling techniques to work with.
For the biologist in you, it’s worth a long look for biologists around the world. Otherwise, you should be looking at one of the top options above.
Free GIS Software List
As we have shown, there’s a bucket load of free GIS software that can:
- Perform hundreds of advanced GIS processing tasks.
- Generate stunning cartography and mapping products.
- Manage your company’s geospatial assets efficiently.
Now that you have a better vision of free GIS software available to you, did we miss anything?
Let us know with a comment below.
Changelog
2022/04/28 – gvSIG moved down a couple of spots to #5. Updated to star ratings, instead of percentages.


I would like to collect gis data using a drone so I can produce a topography of the terrain of a small island. The place is hilly with coconuts and heavy vegetation. What software will I install in the drone so it can collect the gis data? Thanks
Hi Jaime. I don’t do much drone work myself. But the only two I am aware of are:
1. Birdi
2. Drone Deploy
There’s also OpenDroneMap. I believe you can process the data online here, but under the condition that you share with the public.
Should def have a look at Atlas.co among others in the Web GIS space!!
Good & best
Thank you, nice collection!
I have QGIS3 installed but am a rookie. I have what seems should be a simple task to perform. I model pandemics (FORTRAN/MPI) on a spatial lat/lon grid (local to global) with a 30 arc second spacing (.0083333 degrees). Since I model over the N. America currently I would like to take the information from TIGER Shapefiles (FIPS county/state) and map the values onto my grid and save as ascii or something I read from FORTRAN. Currently I have a state ascii file I got from friends at NASA (I’m retired now) but I need the mapped county data so I can initialize the model with county level data. Here are the files I download, I can also get state GDB files.
-rwxrwxr-x+ 1 joe None 5 Aug 17 07:47 tl_2021_us_county.cpg*
-rwxrwxr-x+ 1 joe None 926K Aug 17 07:47 tl_2021_us_county.dbf*
-rwxrwxr-x+ 1 joe None 165 Aug 17 07:47 tl_2021_us_county.prj*
-rwxrwxr-x+ 1 joe None 124M Aug 17 07:47 tl_2021_us_county.shp*
-rwxrwxr-x+ 1 joe None 40K Aug 17 07:47 tl_2021_us_county.shp.ea.iso.xml*
-rwxrwxr-x+ 1 joe None 38K Aug 17 07:47 tl_2021_us_county.shp.iso.xml*
-rwxrwxr-x+ 1 joe None 26K Aug 17 07:47 tl_2021_us_county.shx*
Simple or hard? Better apps for this?
If someone would like to be a co-author on a paper and this task is trivial let me know if you’d like to do it. I’d rather not spend time learning GIS but will if I have to.
Thanks for your time.
I mapped COVID cases by county daily throughout most of the pandemic, once the data started being published by the NY Times. Modeling the data of course is different. Did you find a way to do this? I used to do FORTRAN too, miss it!
Hi Joe I’m not quite sure I understand what you’re wanting the GIS to do or the output you want to see. Are you basically wanting to take your modelling output and finding out what county it is within, and adding that value to the modelling data? In case it helps – GIS polygons like your county area have several files defining the same collection of features (*.prg, *.shp , *.dbf etc) the is the projection of the file, dbf is the data. The only one you need to bring into the GIS is the *.shp file (this references all the other associated files for that data).
Our church wants to map where our parishioners live as well as be able to search by name and show who lives nearby. Will any of these FOSS GIS packages do this?
Sorry, but I haven’t heard of this capability before.
Thank you for the great effort!
Dr. Salem Issa
Hello, I am board member of local non profit, Locust Grove Estate (lgny.org) in Poughkeepsie, NY. It has hiking trails and gardens that include several miles of trails. We would like to have an online map that guests could link to while they are hiking. Google does not show our trails, Open Street Map does. Is there software for us to convert OSM to Google or a way to pick out sections of the huge amount of export OSM on our location?
We would also like to add image links to the map to help our guests navigate the grounds as well.
A big ask but any help is greatly appreciated.
Here’s how I would go about doing this. But there might be other ways for you to do it.
1. First, you would have to download the OSM data. Here’s a guide on how you can download the raw data. OpenStreetMap Data: How to Download Crowd-Sourced OSM Data.
2. From here, you will likely have to clean up and filter what you want to use from the OSM data. You can download an open-source application like QGIS 3 to do any clean-up.
3. Finally, you can convert it to KMZ. But this would only be accessible on Google Earth, where you can upload your own KMZ and overlay it with Google Earth.
This is how I would do this. Not sure about your GIS background, but step #2 would be the most difficult.
Hope this helps
Thanks. It feels like I need something which will run on my laptop not my phone.
I have ended up downloading QGIS, and in a couple of hours of messing with it, and watching Youtube, I have made the maps I want…after having collected field data using Avenza. So, that pretty much meets my needs. QGIS is a ton more full-featured than I would like. It seems there should be an easier way to just throw data onto a topo base map and export a referenced map. But, maybe there isn’t.
Suggestions for a free mapping package, please.
I need to drop waypoints and track logs onto a topo base map, and export a geo-referenced PDF map.
I am not a GIS guy…and, would prefer an easier-to-learn system.
It sounds like you are in need of a field app type of GIS package. Here are some data collection tools that you can use. Most have a free trial with QField being free – https://gisgeography.com/field-apps-data-collection-tools/
For a free, lightweight but easy to use GIS product, check out TdhGIS.com. It installs quickly, with an SQLite database, and provides many spatial analysis tools and some mapping functions. The displays can be exported to TdhCad, for full graphical editing. It imports Shapefiles and OSM data and runs on Linux and MS Windows.
Hi,
First of all, let me preface this by saying I’m a complete ignoramus on this subject! Just reading the comments left me feeling like I was trying to read a language I am unfamiliar with! That said, I’m not a total idiot, I have average intelligence, just not on this subject.
I’m looking for a sitter or program I can use for astro archeology; searching for pyramids or temples covered by jungles or sands, for instance, using satellite imagery such as LiDAR to peer through whatever is covering them. I would love an option that allows you to see deep beneath the ocean as well, if that is even possible. (I wasn’t sure if LiDAR worked on water or not, like I said this is a completely new and alien field to me!) I would greatly appreciate any recommendations of sites or programs that would allow me to search for ancient ruins without being overly technical or too complicated to understand for a beginner.
Thanks so much in advance!
Raven
Hi
Are there any free GIS with JS API that is possible publish of maps?
Anyone got a link where can I get Falconview?
Hi! I am looking to map out the valves and manholes for our water and sewer departments. It would be great if the maps could then be usable out in the field on a phone with live location readings. Would any of these programs fit the bill? Thanks!
Hi Larry
If you’re looking to go the open source route, then QField may be the best option. https://qfield.org/ First, it’s built on top of the QGIS open source project, which is where you’d set up your maps. Once you build it on your workstation, you can deploy them in the field through QField.
If you want to use proprietary software, Collector for ArcGIS is a good way to go. Basically, you build a webmap through Esri’s cloud service ArcGIS Online. From here, you can download the Collector app and use it out in the field. They also go hand-in-hand with Survey123, where you create forms for users to fill out. I believe it does have a free trial (or AGOL storage limit) to test out beforehand.
There is also Spring GIS from Brazil (http://www.dpi.inpe.br/), but I’m not sure it’s supported anymore.
Lets say one wanted to generate semi-high res contour maps of a rolling area of land.
My inclination would be to walk either quasi-on-contours or around areas of vegetation / topography types making notes, and then download the location trace files from Google Takeout and then pull those into some 3D GIS / cartographic package which could then generate a smoothed 3D surface from the trace files from which true contours – maybe of a 1 meter interval could be generated…
I thought maybe asking for some general do/do-not directions and software and methodology recommendations would be prudent rather than my usual bushwhacking…
Mark Volz
I have software that does not require installation, but it is basic to view cad and shapefile files.
This week there will be a new version with some improvements. You can google it as “Multimaps Desktop 0.8”
Regards!
https://sourceforge.net/projects/multimaps-desktop
Hello,
Is anyone aware of any GIS software that run without being installed? I would like to give our Emergency Manager a few thumb drives with GIS data and software on them. This way, in the event of an emergency we could allow volunteers the ability to quickly spin up GIS in the field without concern about needing local administrator rights.
I am aware of the OSgeo4W project, but I would prefer something less complicated that can run on Windows.
Thank You!
Hi
I read BSc. Natural Resources, I’ll like to further my studies in GIS (MSc. GIS). what pre-requisites would I need to pursue this program and what job prospects are in this field?
NB: I already took some models in the first degree ( GIS & Remote Sensing, and Application of GIS). Thank you.
I am a software developer but new to shapefiles. I have addresses and a shapefile of county voting precincts. My batch query would be to return the precinct number for a given address. Can you provide insight into which tools/features to use?
First, you have to geocode the addresses. Here are some options how to do that. https://gisgeography.com/geocoders/
Next, you can intersect these geocoded addresses to the precinct layer. This will attach the precinct attributes to the addresses
Very important and useful software.
But are these free software safe and trustworthy?
Yes, in my experience (past decade or so). QGIS does crash occasionally but then so did ArcGIS, but less regularly. I have used a bunch of the Open Source GIS and have never had a virus etc introduced to the system.
Hi, I have an old GIS product called Infomap (not MapInfo) which does the simple tasks I want to import and display different layers by year and other criteria of flight survey centre points over a map base. Unfortunately Infomap does not allow ‘turning off’ of layers by dates and so over time the base map is lost under millions of centrepoint dots making it impossible to search. I need an easy to use GIS programme which will import csv, txt or xls files as separate flight layers which can be turned off or searched by a date range and I don’t want to pay a fortune. I tried QGIS- which crashed my PC and will not be reinstalled. Can anyone recommend a suitable programme please? Many thanks
Which version of QGIS did you install?
Hi, I am on a project that requires me to map down the disease cases. I would like to see the high risk area and low risk area. Besides, I also need to map the target location (recreation area) so that in the end I am able to see either the high risk disease area that is overlapping with the target location. Kindly suggest which GIS software I should use. Thank you.
I am a geologist currently use Mapinfo 8.5, which is barely an improvement on Mapinfo 4.5, and now Mapinfo is somewhere around MI15 or so and I have no intention of buying yet more upgrades for a relatively clunky cartographic/GIS system. I am thinking of migrating to QGIS. A key issue in geology is the third dimension and having symbols (e.g. dip and strike of strata) so as to image 3D on a 2D map. Discover was written to accompany Mapinfo a good time ago to do this but again one pays through the nose to buy it and its upgrades. Is there any freeware add-on to QGIS that will do what Discover does?
I’m new to GIS software and am looking for something where I can map out golf courses (with topography option would be a bonus). The data needs to be to scale where I can add template grids or symbols to a layer and retain the scale relative to the geography (e.g. if the symbol is 100y long, then it needs to retain that size when pasted over the geography). I also need to be able to save distances or dimension to different places with annotation. I presume all of the packages above import data from Google Earth. Is there any other source where accurate data can be imported?
Thanks any help would be appreciated.
Hi Gary
Your idea for using Google Earth to map out golf courses is one of your best options. If you want to go open source GIS software, then I recommend using QGIS for this task. Google Earth creates KMZ files. You can take these KMZ files and import them into QGIS where you’d add it to a database. From here, you can create maps, analysis and general data management.
If you want to work directly in QGIS, there are plugins to enable Google imagery. Now, it’s recommended to use the QuickMapServices plugin. If you want to add Google and Bing basemaps, you can go through the settings and click “More Services”. From here, you click “Get contributed pack”. After downloading the contributed packages, you will be able to web services from Google and Bing.
As for existing data for golf courses, you can contact the state or city to see what’s available. Are there any open data hubs for where you live? The other option is the crowd-sourced OpenStreetMap Data. Completeness varies for where you live and it’s getting updated every day from people around the world. Here’s an article how to download OSM data: https://gisgeography.com/openstreetmap-download-osm-data/
I have spent a lot of time over the past 35 years developing the OzGIS mapping system. For the first ten years it was a CSIRO research project, and after that a private development project.
I do not want to see my efforts wasted, so would like everyone who is interested in mapping to be able to use OzGIS. I have released all the source code so it can be further developed.
OzGIS should be of value to users who are interested in the display and analysis of attribute data like Census demographics, government statistics or business data, and who use Census data in applications like site selection, territory definition and catchment analysis.
The software can be downloaded from SourceForge https://sourceforge.net/projects/ozgis
* Completely free
* Runs on Windows and Mac OS X
* Source code download available (compile for Linux etc)
* Sample map data (usually download from Census bureaux and map agencies)
* Manuals, YouTube demonstration videos, Pinterest board
There is a community flag flown all over the world. I would like a simple GIS (or online mappping tool) where individual contributors can pin their video or photo with a few data items – showing the flag in action. Rather than one person (myself) mapping the lot via a spreadsheet for uploading to an online map publicly available.
I would like to find an open source code GIS that has the capability to automate Google API report pulls? Can anyone point me in the right direction? Thanks any help appreciated!
Addendum to question above … QGIS looks great, actually much more powerful capabilities than our simple needs — can it export maps created in it to pdf format?
Thank you
Hi,
Thank you for your review of mapping programs. Very thorough, but I’m still confused, hence this question:
Which of the programs would be best for (1) mapping sets of geocoordinates (decimal degrees) on to the 5 boroughs of NYC — ideally, showing some street detail, and (2) allowing us to plot freeform lines and straight vectors in different colors to show viewers the courses of vanished waterways, current and abandoned subway tunnels, tectonic fault lines, etc?
Also, we’d like to be able to crop the map to show this detail close-up, section-by-section. As well as develop a map showing all 5 boroughs at once, with the ability to crop out NJ and Long Island beyond Brooklyn/Queens. We’re PC users, but not super technical.
Thank you
Your best option for mapping and any type of cartography is QGIS.
Does anyone whether any of these free programs can do things like converting a landxml file to a tin? What about tin to raster? These are the two most common tools available under the 3D Analyst set of tools in Arc that I use. Our company has 2 licenses and they are always in use. I would love it if one of these programs has these tools so that I can do these conversions whenever I need to, it would help me immensely. Does anyone know anything about this?
I’m looking for an option to have our clients open our orthomosaics, which we’ve collected and processed for them, and digitize polygons using the imagery. A simple platform is best because they are not tech-savvy. Any suggestions?
which one of these would work best for doing viewsheds
I’d suggest the Visibility Analysis plugin for QGIS
I have a 15 year old grandson who is totally smitten with geography and mapping on a global scale. He’s quite computer savvy, of course, and I’d like to give him something in the way of GIS or mapping software to get him headed toward thoughts of a career. Which of the above, or other reasonably priced software under $100 would you recommend?
I would recommend QGIS from the list
Hopefully you’ve found an answer by now Denise. But for anyone else interested as far as I know there is no commercial GIS that is under $100 – a more realistic price would be at least 10x that figure. Also don’t assume mapping and GIS are entirely the same thing. A GIS may have decent or poor mapping capabilities, they come in many flavours, e.g. Manifold is a nice price and great at processing huge chunks of data but it’s mapping capabilities are lower than QGIS/ArcGIS. QGIS is my go to GIS but it has many advanced options which might be off putting for someone new to the subject (however there is a very active community around the software and decent youtube videos etc to help). When I was new to open source GIS I was fond of Mapwindow and the EPA BASINS version (excellent at hydrology mapping) and found them very easy to get started with.
Hi, I have never used any other software than Google Earth in mapping. I’m just really interested to have a software that would help me get a geo-tagged satellite image and make it an overly to google earth. Can you help me with this, please?
I have provided instructions how to do that in the following article –
https://gisgeography.com/wildfire-maps-real-time/
See under Google Earth Pro
Hey I want to develop an application to find out the source of signal transmission from SDR placed at various geographical locations. The system collects the direction of signal and the data from various sources is collected to find out the location of transmission through triangulation on map. Which GIS package can help to develop this application?
I’m studying environmental engineering, we recommened to make map for water supply, sewarage system and solid waste management, which software I can use to make that map? And how?
As a field ecologist most of my mapping requirements can be achieved using Google Earth or similar. However I have a local government client who requires shape files to import into ArcGIS. These will need to match ortho-photos. The cost of ArcGIS isn’t warranted and QGIS looks possible but it looks like QGIS doesn’t output files in an *.shp format, is that easy to remedy?
I also would like to work with the LENZ data set, This has 15 raster layers covering the whole of NZ on a 100m grid with numerically defined environmental parameters. I looked at your list and shortened it to QGIS, Grass, ILWIS, GEOda and OpenJump. If possible I only want one gis system, preferably one that is reasonably intuitive as my level might be described as 1 day introductory with ArcGIS
GGIS can export files in many formats including shp files. In fact I can’t readily think of a GIS that doesn’t allow this facility. In case it helps others: GeoDA is good/excellent at examining data from a statistical point of view. It is not great at many other tasks that a “regular” GIS can do. I use it as an additional tool alongside another GIS. Although you are relatively inexperienced you might get along with QGIS as there are heaps of demos and you tube videos. As an aside I’m slightly amused by the number of people who are wanting to find something ‘simple’ for quite complex and specific processes (OK I know you said intuitive which is different). If I was going for one GIS system it would be QGIS (as it is fully featured), but I would expect to put in some effort into learning how to use it. In your specific use case you might find SAGA or GRASS has the tools you need, I don’t find these as intuitive as QGIS for general use, but for a specific purpose they might be easier to use overall. BTW QGIS can access the SAGA and GRASS tools as well.
What about mapserver and geoserver?
Looking for map system that show boundaries for ZIP Codes, County lines and City lines in Texas. I need to input address (~10,000) to see if address is inside/outside these boundaries. Appreciate any suggestions for software. Thanks.
Have you tried US Census and TIGER? You should be able to find them there
As a long term MapInfo user I prefer a GIS that is file and dataset based rather than Project based. It seems to me that most if not all of the software listed above follow the Arc project system. Are there any that let you get straight into the data and then save your collection of data files afterwards?
Hi, I have approx 70,000+ geotagged photos that I would like to map and overlay geology maps etc.
I am adding to them everyday so I was wondering what would be the best way to do it. I have uploaded them to the iCloud but it may to slow to generate maps with such a large data set. My mac is just about out of memory and iPhotos and Photos struggles to cope.
Any ideas ?
Hi
I am a mature student doing my dissertation on tidal and wave renewable energy structures in the Bristol Channel off the Welsh Coast. I am new to GIS. Can someone tell me please if there is a free open-source GIS software package that I can upload onto my laptop (windows 10) to allow me to view 3D images of the seabed off the South Wales Coast?
In fact, you can do this with the newest release of QGIS 3.0. It’s in ‘testing’ now, but from what I can see, the 3D interface in QGIS 3 is pretty slick! https://qgis.org
Best of luck to you and your project.
Hello. Using GIS I would like to create maps that would show the population capacity, body/bodies of water and its status(clean or not) in the place, woodland area and the plant and animal species, so that I can make informed decisions on maintaining ecological balance.
Hey. From a given map, if I want to extract only the roads that are present in the map, is there any method that I can use to do so?
Since I want to get the shortest routes from one point to another, I need only the routes but I am not able to know how can I do this…So it would be great help if someone can help me out with this
I assume that it’s an image file such as a JPG? You would first have to georeference your image. Here’s a guide on what that is: https://gisgeography.com/georeferencing/
Next, you would have to vectorize the roads. Depending on how many roads, there are automated ways to do this like with ArcScan. https://gisgeography.com/how-to-vectorize-image-arcscan/
You might also try Cloud GIS. You can do a lot of your basics with its free account and it doesn’t depend on you to have a processing monster for a computer – giscloud.com
Boundless has also developed a great comprehensive package using all sorts of free software. The best thing about Boundless is that their primary is consultation so there is almost endless support through blogs, documentation and videos. They have a great community – boundlessgeo.com
Which would you recommend for live streaming agricultural data. We need to be able to process and display millions of dynamic moving points at a time. We also need to be able to string them together and create tracks, etc.
Hi
I am an obsessed fisherman and would like create a map showing plot depths, changes in water parameters, currents, features and fish catches of a waterbody. Which GIS software would you recommend?
I would recommend QGIS. However, obtaining this type of data can often be challenging. Best of luck for your project.
Which would you recommend for live streaming data. We need to be able to process and display millions of dynamic moving points at a time. We also need to be able to string them together and create tracks, etc.
Not sure if there are any free options but ArcGIS Online’s GeoEvent Server might help with this. ArcGIS Online is free until you surpass credit usage
Hi, I’m a mature student doing A level geography, and want to use GIS software for my fieldwork study, investigating the carbon matter versus drainage on areas of peatland. Which GIS software would you recommend for that? Many thanks, Jo
Since you are going to be out in the field I would recommend two applications.
The first I’d suggest is QGIS. The reason is because it has a good field app for Android called QField for QGIS Experimental. Basically, the app helps you get data from the field to the office efficiently in a minimalist way. I’ve heard good things but haven’t tried it myself. It has 4.2 stars out of 5 so it can’t be too bad.
Another option is using Collector for ArcGIS in combination with ArcGIS Online. It has an app for Android and Apple. It does give you a certain amount of credits where you can use it for free, or a free trial for a period of time. Collector is solid, but Esri is a commercial software company that eventually wants to make you a customer. It’s a good way to test out the product, but you have to realize that you don’t get the full-blown thing with a limit.
Hope this helps
Hi! For purposes of my thesis, I plan to use qgis to map a spatial data layer of average agricultural yield of different crops in Colombia (such as coffee, sugarcane, oilseed, etc.) over a shapefile of Colombia divided in all its 1105 municipios and 33 departments (states).
At the end, I would like to obtain a complete picture of the agro-climatical suitability of different crops per municipio in Colombia. However I have some problems. Firstly, I have some problems finding the needed data in the right format. Does somebody knows a database where I can find such shapefiles as I need from Colombia?
For the data on average agro-climatical yield, I was told to look at United Nations FAO’s website for GAEZ maps, however I only seem to obtain .jpeg images from this site, not really useful… Does somebody has some experience in this field and knows where I can find the data?
Lastly, I am a beginner with qgis, or gis software, so a short tutorial on how to map different spatial data layers on each other would be very welcomed! Thanks in advance! Sophie
Hi Sophie
The first link is just an image. You are going to need the GIS dataset found at the FAO GeoNetwork. You’ll find it in the search by typing “crop suitability”. Each crop (maize, cereals, vegetables, etc) has its own data set. Values in it range from 0 as very marginal to 100 as very high.
For the Colombia municipalities, go to the Esri Open Data Hub and search for Colombia sub regions or municipalities. It should turn up there, or directly contact Esri Colombia. These links are found here: https://gisgeography.com/best-free-gis-data-sources-raster-vector/
As for the analysis, it depends on what you want to do with it. A common analysis is measuring suitability per municipality by creating a pivot table report. Here are the steps to do this:
1. Open QGIS. Add the two data sets by dragging the .SHP and GRID files in.
2. From here you can work with the crop suitability raster data as is, or convert to vector.
3. If you have a vector, the GroupStats plugin will help you summarize by municipality.
4. If you are working with crop suitability as a raster, then you can use the “Grid Splitter” plugin with the municipalities as the cut layer.
5. Calculate the area in hectares for each municipality. In Excel, take the average ‘suitability value’ per municipality.
Now, you might have to do this for a lot of different crop types and their suitability. In this case, you might want to create a ‘Processor Model’ to automate the workflow for each crop suitability.
I am looking to do a project to map Naturalization Records, to show where people originally immigrated from and where they ended up (I want it to show the trail\line). What I want to be able to do is, when you click on the originating spot, have an image instead of a dot and when you click the image you will see the data that I input to come up. Does anyone know which one or if any of these programs would work for this? Thank you!
Gawie du Toit – I may be able to do the maps for you. Sounds like a fun project.
Nathan – QGIS works great on a Mac
I’m looking to install on my mac and to be honest, the installation directions concern me. Is the QGIS stuff actually Mac friendly?
Fantastic program for PC but not sure about Mac, sorry.
Could you perhaps help me with some advice?
I’ve been typesetting an annual South Africa wine guide for 17 years and, more or less by default, have been drawing the maps that show the locations of the wineries. I’ve been doing these in CorelDraw, usually tracing an image of a map imported into a layer reserved for that. There are 20-odd maps showing the locations of several hundreds of wineries.
I would love to be able to do this properly, using real-world co-ordinates, and showing the topography. I would like to add all the wineries, and output windows showing specific regions at different scales (some maps cover large areas; other cover much smaller areas densely populated with wineries).
Where should I start? I’d like at least to begin with free software, to see whether I get the hang of it. Can you suggest what would be the best to start with?
Many thanks
Gawie du Toit
I should probably write a whole article how to do this, but I’ll go ahead and list the steps below.
Step 1) You’ll need to download GIS software and data. My suggestion is to use QGIS and Natural Earth data. The reason why you’ll want to use Natural Earth is because it’s completely public use and they give permission to modify, disseminate and use the data in any manner. Here’s how to download – https://gisgeography.com/natural-earth-data-free-gis-public/
Step 2) The next thing you’ll have to do is go into the ‘Quick Start’ folder in Natural Earth and open up the .QGS file in QGIS by double clicking it.
Step 3) I don’t know if you have coordinates for each winery or not. Either way, you’ll have to create a shape file with each winery. This might take some time, but once it’s created you will always have that data to work with as a layer. There’s a button on the left panel ‘New Shapefile Layer’. Make sure you choose ‘Point’. Give the shape file a name. You can add fields to your shapefile, which are like columns in a spreadsheet. For example, you can add the field ‘NAME’ as TEXT 100 length, which will be each winery name. Click ‘ADD FIELD TO LIST’ and save your shape file somewhere.
STEP 4) Now, it’s time to add point locations on the map. You’ll need some imagery to see where each winery point should go. Go to Plugins > Manage and Install Plugins > Search for the Open Layers plugin and Install it. Under Web > OpenLayersPlugin, you can add Google, Bing or OpenStreetMaps imagery to QGIS.
STEP 5) Finally, you can add points to your shape file. In the Digitizing Toolbar (usually at the top), click the pencil icon to toggle on editing. Click the ‘Add Feature’ button to add points to the map.
Keep on adding points until you have all the wineries. To create a professional looking map, you can use the Natural Earth data as you’re basemap. Using QGIS Composer, you can add cartographic elements like a scalebar, north arrow, title, etc… Export as an image file or PDF.
Thank you for putting this list together.
We are a Land Surveying Firm that needs to input 40 years of jobs into a basic spatial format (AutoCAD is not user friendly for everyone). We would like to use client data like address and parcel numbers to create a map showing the location of all of the jobs we have done. Which GIS system do you recommend?
For this type of task, I would recommend QGIS.
Thanks for your reply. Arcgis and fulcrum require high annual subscriptions which is not desirable. Qfield is for android only. Sorry to keep asking but are there any other options?
Hello. I am a single individual looking to map a woodland which I have just purchased. Using GIS I would like to create maps of the woodland including the locations of individual tree species,their health,ground type,animal holes etc, so that I can make informed decisions on sustainable forest management. I currently have an iPad with gps capabilities to use on the site to collect the data, and will be buying a new computer soon, but am having difficulty finding the right program to use. Could you please help me with any suggestions about software and if it is Apple compatible many thanks John
Here are some of your options:
Hi. I am looking for something really simple. I’d like to send out an email survey that includes a local map. I’d like the recipient to drop a pin on their residence. The goal is to map all the recipients’ residences. Ideas?
Maybe someone else might chime in for web mapping options.
Something open with the customized functionality of Tomnod would be ideal. They openly hold campaigns to map out islands, buildings, disasters and even the search for Malaysian flight MH360.
I don’t have any experience with Ushahidi but it’s also been used for crowd-sourcing and citizen engagement.
Let me know what you come up with.
This is a great article. I use Badger Maps for my mobile phone. I can transfer all my data from laptop and have it right on my phone.
are there any that will work on mobile phone?
You won’t be able to get the full functionality that you can from a desktop GIS. gvSIG and QGIS have mobile apps for data collection.
Thanks for your extensive list. Here are a couple of other open source software you should add to it:
InterImage: http://www.lvc.ele.puc-rio.br/projects/interimage/
OSSIM: https://trac.osgeo.org/ossim/
TerraLib: http://www.terralib.org/
Nice article. A few comments about FalconView. FalconView was originally part of a flight planning software suite developed by Georgia Tech for the National Imagery and Mapping Agency (NIMA, the predecessor to NGA). It allowed military pilots to use digital versions of NIMA flight planning charts, including taking their flight plans and overlaying the plans on the charts. Pilots could also overlay multiple point symbols on the charts. Others soon discovered it was useful for making and printing basic maps quickly. I haven’t used it in years. It looks like GT continues to add functionality to the software.
Very interesting, thanks for the comment!
Another option is R. Because it does not rely on a GUI, some people find it tricky to get started. But once you figure out the syntax and command-line workflow, it is undoubtedly one of the most powerful GIS systems going. Regarding gestatistics, it simply trounces competitors due to the vast array of contributed packages provided by statisticians: https://cran.r-project.org/view=Spatial
A great introductory resource on R for spatial data is provided by James Cheshire and myself and is free to download here: https://www.researchgate.net/profile/Robin_Lovelace/publication/274697165_Spatial_data_visualisation_with_R/links/55254f220cf24fc7fdeecf7c.pdf
Note the opening quote by Gary Sherman who created QGIS:
“With the advent of ‘modern’ GIS software, most people want to point and
click their way through life. That’s good, but there is a tremendous amount
of flexibility and power waiting for you with the command line. Many times
you can do something on the command line in a fraction of the time you
can do it with a GUI.”