6 Amazing Global Farming and Agriculture Maps
Ever wonder where your food comes from? We have 6 agriculture maps to show you the answer.
Almost every bit of the food we eat is grown and gathered on farms. Humans have learned how to change the environment to boost crop production. We’ve also learned to produce more crops with less land.
But there are a number of issues that threaten agriculture sustainability. For example, population increase, climate change, and water stress impact farming.
Feast your eyes on these agriculture maps and learn what the future of farming holds.
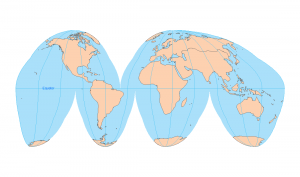
1. Agricultural Water Risk Atlas (Aqueduct)
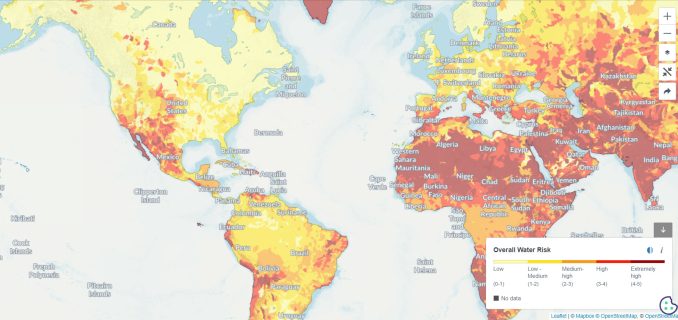
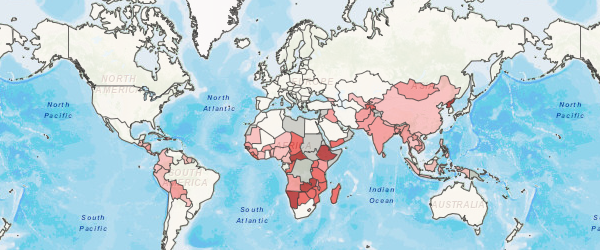
Agriculture takes advantage of the nutrients in the soil and the amount of water that is available. Water is the key. When crops aren’t getting enough water, farmers have to find ways to bring water to the crops. This is called irrigation. Irrigation can change dryland into fertile farmland. To get the water needed for crops, we build reservoirs and drill deep wells. Irrigation is a big part of farming.
The World Resources Institute has mapped out where these water stresses exist in the world. The Agriculture Exposure to Water Stress Map measures water demand to supply. In other words, it takes into account the ratio of water withdrawal to availability. For example, countries like India, Morocco, and the Philippines face high cropland water stress. It also displays other major commodities like coffee, rice, and cereals.
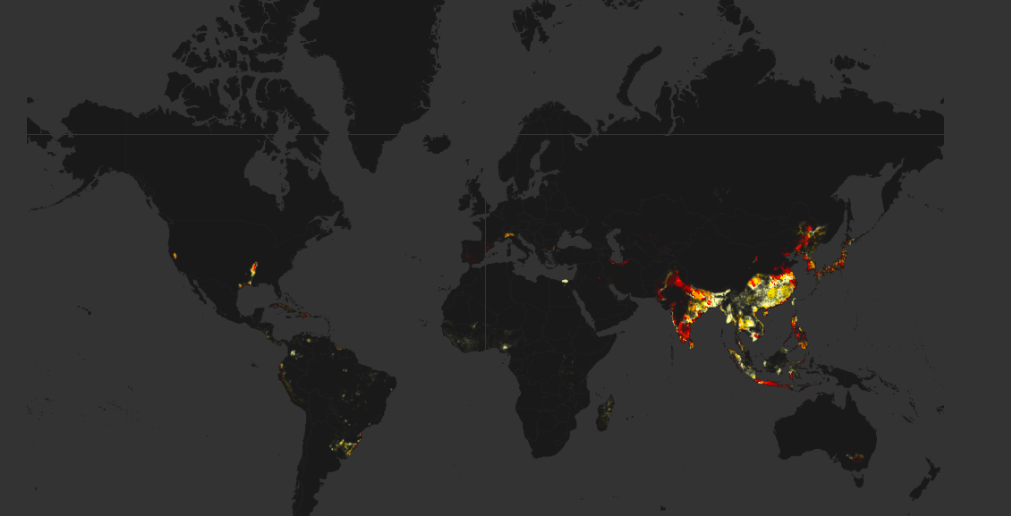
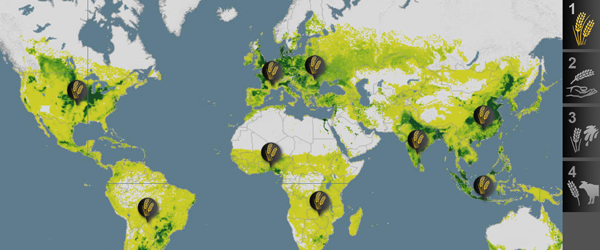
2. Feeding the World Map
Crop production will have to double by 2050 to fulfill the needs of a growing and increasingly affluent population. According to the University of Minnesota, meeting this challenge will be difficult but not impossible.
Can global crop production meet future demands? The University of Minnesota is exploring solutions to the biggest problems in agriculture. This is the purpose of the Feeding the World Story Map. In order to tackle this growing problem, we will have to:
- Make croplands more productive
- Increase water use efficiency
- Change crop use & diet
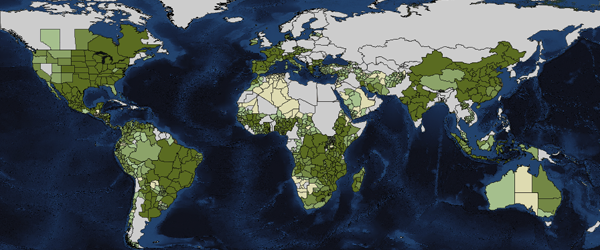
3. World Bank Agricultural Land (% of land area)
World Bank has a unique set of Agriculture Maps showing historical and future farming trends. These maps provide valuable insights for policymakers, researchers, and farmers to make informed decisions and strategies for sustainable agricultural development.
These agriculture maps include:
- Agricultural irrigated land (% of total agricultural land)
- Agricultural land (% of land area)
- Farming machinery (tractors per 100 sq km of arable land)
- Agriculture, value added (% of GDP)
- Agriculture, value added per worker (constant 2005 US$)
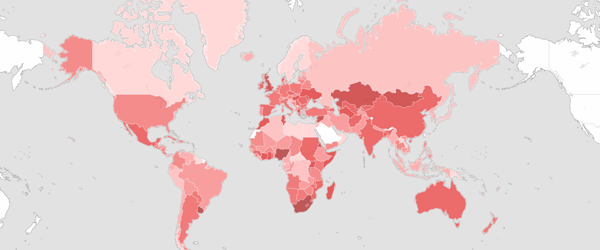
4. Food and Agriculture Organization Hunger Map
One in seven people on Earth lives on less than one dollar each day. Hunger means going without an adequate meal for days. It prevents adults from working and stunts the growth of babies. It affects one out of nine people every day. The majority of hunger issues are in developing countries.
The United Nations is combating hunger with its Millennium Development Goal (MDG) program. The UN has set a target to halve in the developing world. The interactive UN Hunger Map raises awareness about global hunger.
5. ISRIC Soil Grids 250m
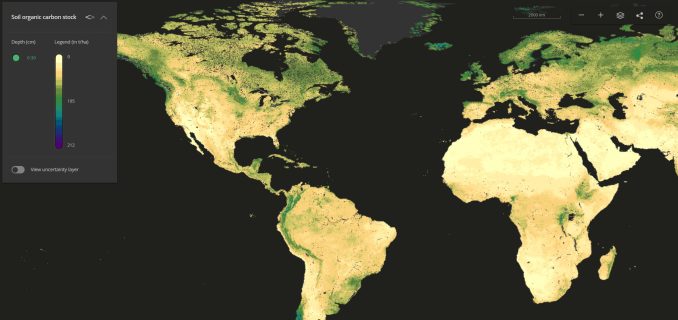
Plants live in dirt. Bugs, worms, roots, and dead leaves make their homes in rich topsoil. In the soil business, this is the “organic material”. Let’s say topsoil is comprised of 10% organic material and the rest is sand and rocks. The nutrients that plants take up in their roots come from that 10% organic material. Without organic material, hardly any plants could grow. And it takes centuries for topsoil to grow.
But other factors come into play for crop production. Soil texture (sand %, silt %, and clay %) is important because it influences nutrient retention. ISRIC’s 1km Global Soil Map helps with agriculture decision-making. It has properties like taxonomy, organic carbon, and pH. For soil texture, there’s also sand %, silt %, and clay %.
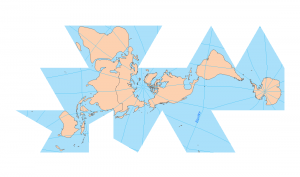
6. FAO Global Spatial Database of Agricultural Land-use Statistics
The Agro-maps application breaks down primary food crops by sub-national administrative districts. It aggregates by crop production, area harvested, and crop yields. This data empowers local authorities and stakeholders to target specific regions for agricultural interventions and enhance food security initiatives.
About 40% of the global workforce is in agriculture. That’s 1.3 billion people. This means that agriculture is the world’s largest provider of jobs. In FAO agro-maps, you get a limited yet very important component of land use.
Agriculture Maps for Decision Making
Agriculture feeds the globe. In these agriculture maps, we see which crops are best suited for each environment.
Farming also faces several problems. For example, population increase, climate change, world hunger, and water stress.
All things considered, agriculture maps can convey this information to make knowledgeable decisions.
Now, these 6 agriculture maps have boosted your understanding of agriculture. Explore the world more with maps by reading:


Too many people and housing in farm lands!
wish had plane that spray grass seeds
Hello, I am citing this article in a research paper for my Business Informatics graduate program. Is there an author I can credit?
Thank you.
We very much appreciate the citation. Here’s how to cite it:
6 Amazing Global Agriculture Maps – Farming Visualized / Available at: URL : https://gisgeography.com/agriculture-maps-global-farming/ –Title from Screen. –Date of Access: 11 November 2019.
If you go to Google Scholar and type in gisgeography.com, you’ll find 400+ examples of citations to the gisgeography.com. Please take a look for other examples.
The new version of the soilgrids system is at a 250 m resolution grid (the first version was 1km grid cell size)
https://www.isric.org/