A List of Highways and Roads GIS Datasets
We list the top geometric networks as GIS data sources that you can use for routing, geocoding, map display or any type of network analysis.

We list the top geometric networks as GIS data sources that you can use for routing, geocoding, map display or any type of network analysis.
These are the 30 defining maps of the United States. This United States map collection has everything from reference, climate and elections.
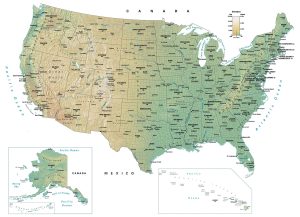
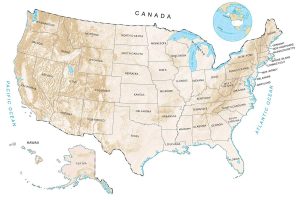
This map of USA displays states, cities and census boundaries. An elevation surface highlights major physical landmarks like mountains, lakes and rivers.
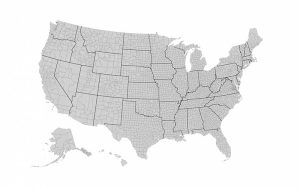
A US county map that displays the 3,142 counties and equivalents including parishes, boroughs, census areas, independent cities and the District of Columbia.
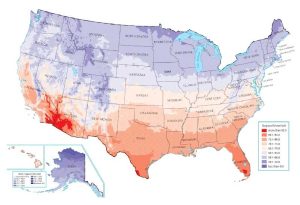
Check out the US temperature map to visualize how climate varies across the United States of America. Each one is derived from NESDIS, a branch of NOAA.
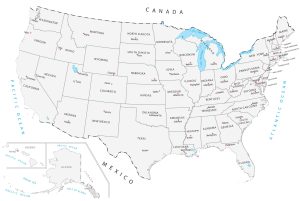
From Alabama to Wyoming, we display all 50 US states and capital cities. This United States map with capitals is a simple representation of continental US.
There are really several ways to see elevation in the United States. But the most common way to see a US elevation map is through a digital elevation model.
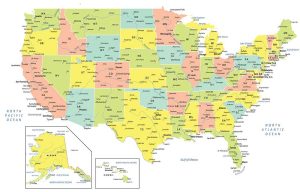
A USA map with states and cities that colorizes all 50 states in the United States of America. It includes selected major, minor and capital cities.
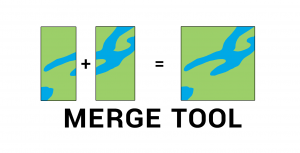
The Merge Tool combines data from multiple sources and puts them into a new data set with the same shape type (points, lines, or polygons).

Python libraries are the ultimate extension in GIS because it allows you to boost its core functionality. Here are the best Python libraries in GIS/mapping.