US Elevation Map and Hillshade
There are several ways to view elevation in the United States. But the most common way to see a US elevation map is by using:
- Digital elevation model
- Hillshade surface
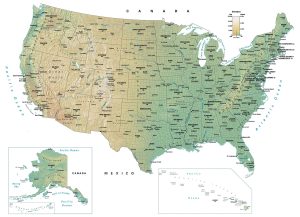
- Physical map
Let’s check out all 3 ways to see how height changes in America.
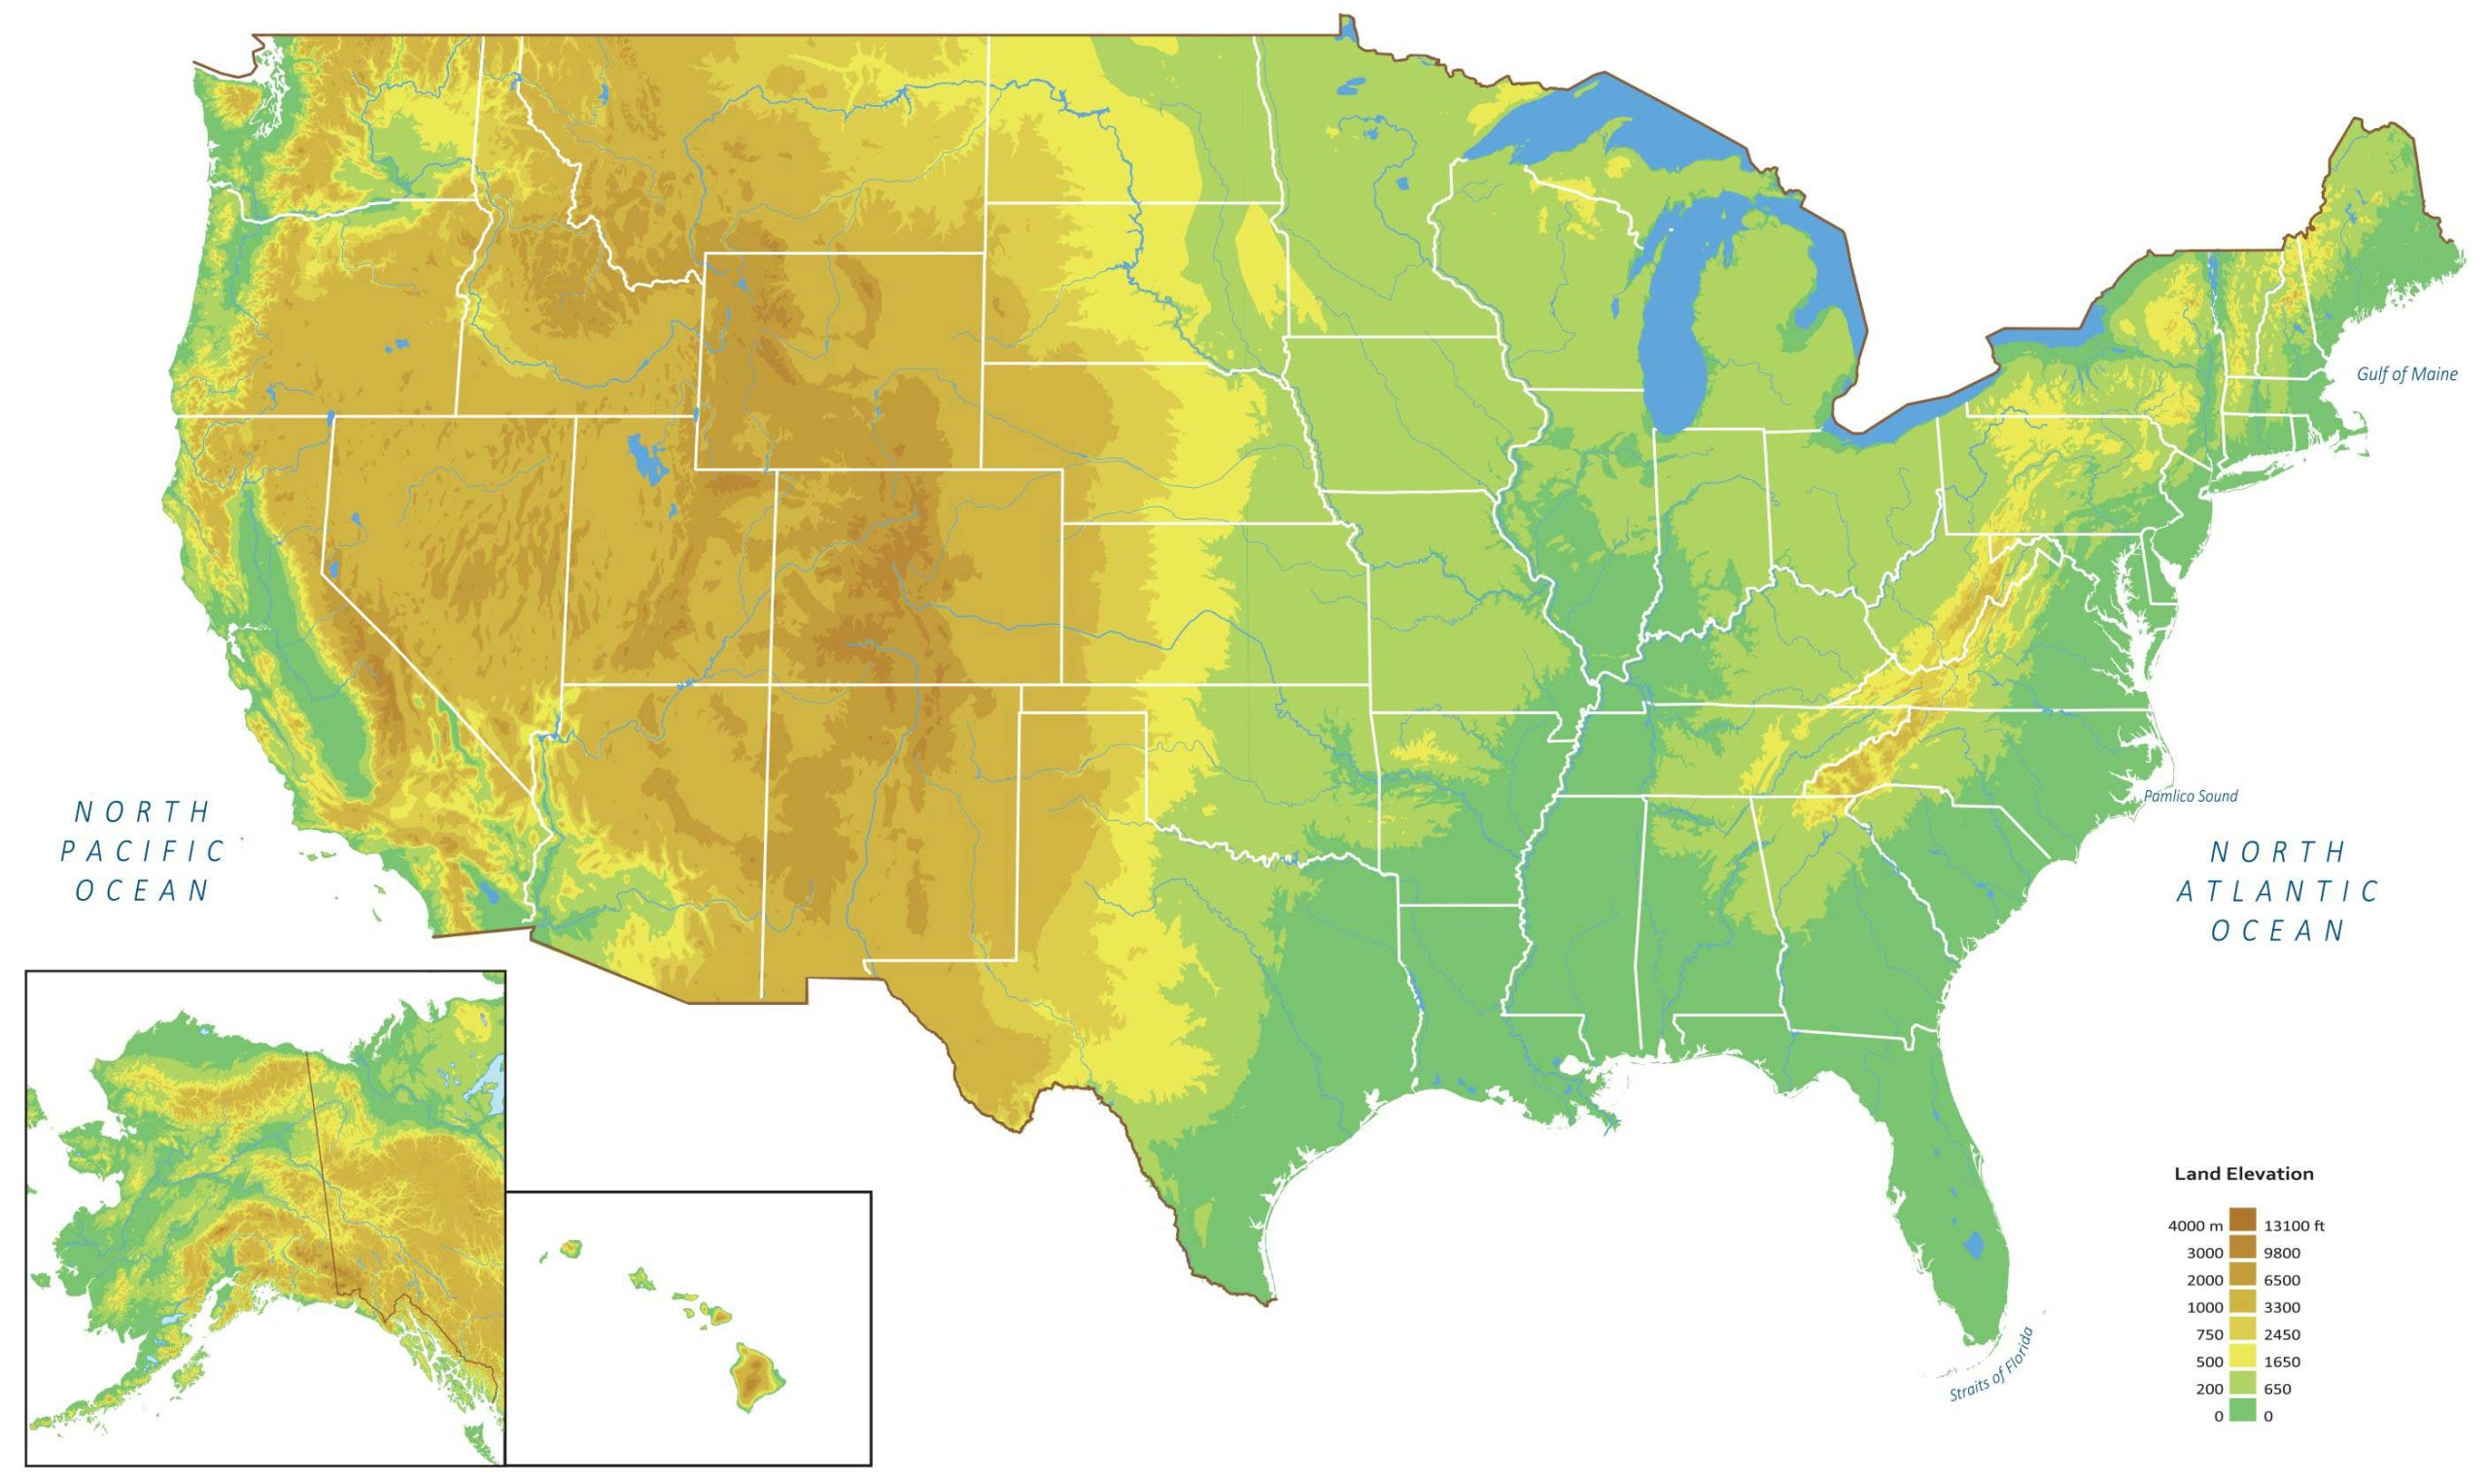
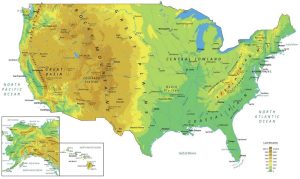
1. US Elevation Map
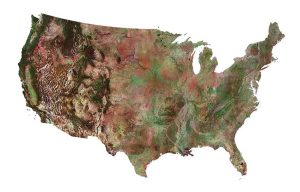
First, this US elevation map depicts height by increasing color. In this map, elevation ranges from 0 to 13,100 feet above sea level. For metric system users, it goes from 0 to 4000 meters. But keep in mind that some mountains extend beyond this peak elevation. For example, Denali, Alaska rises 6190.5 m and appears orange.
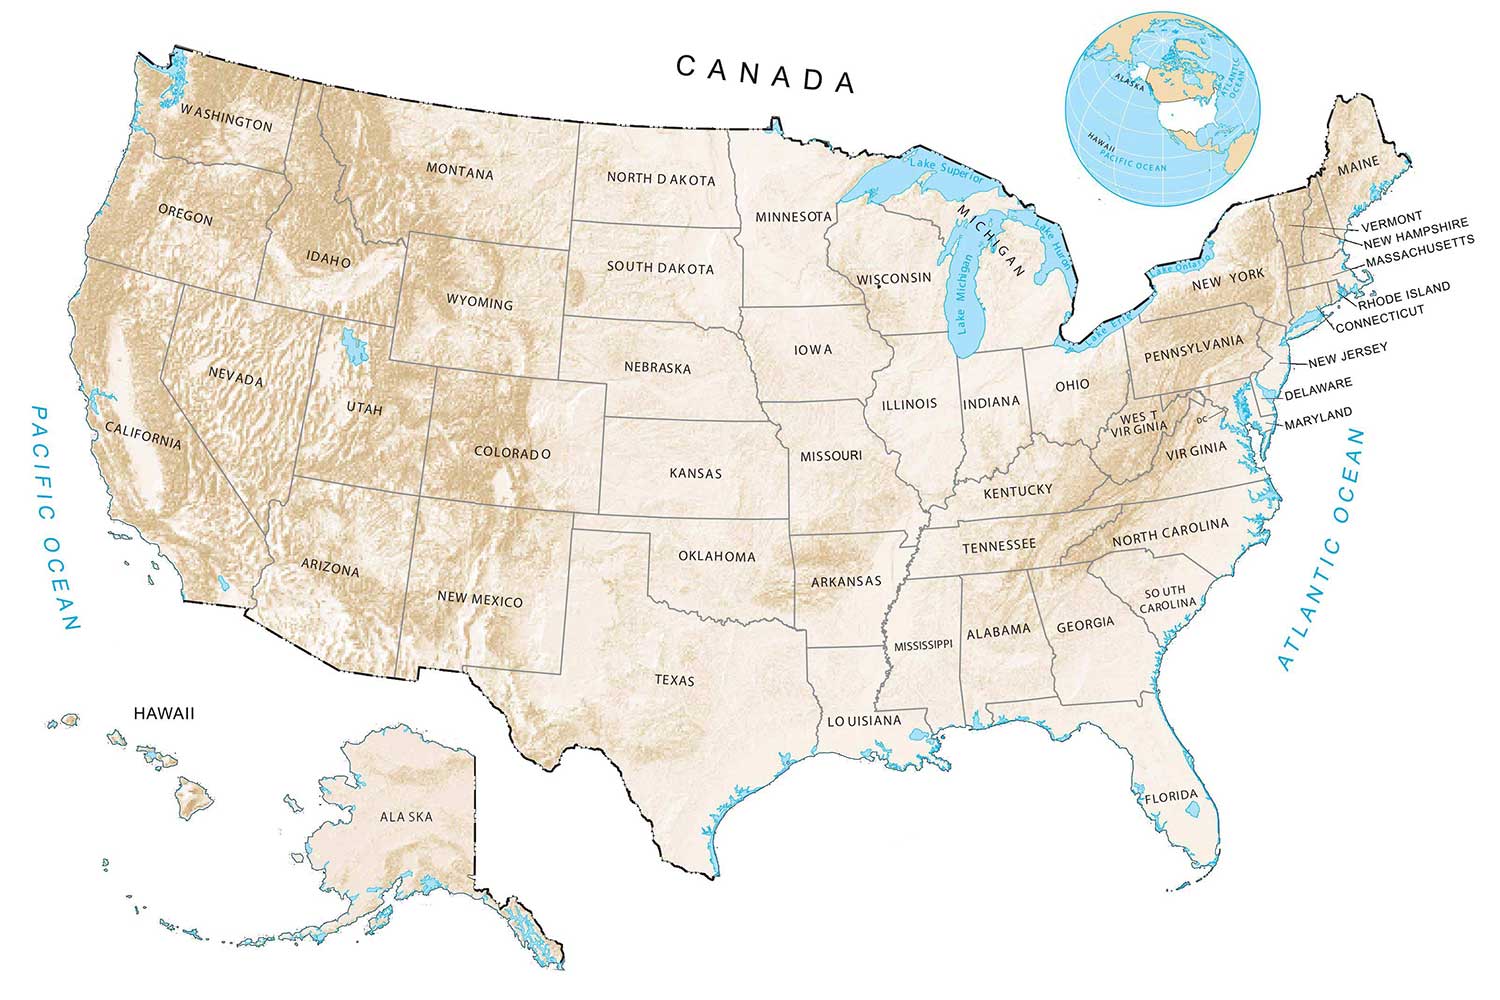
2. US Hillshade Map
The alternate way to view elevation is by using a hillshade surface. As the name implies, it shades peaks and valleys based on the position and angle of the sun. For example, here is a US hillshade map, which equally displays elevation. But it’s in a much more unique way and highlights peaks and valleys.
I’ve also found a neat resource from USGS. It uses the National Elevation Dataset (NED) for shaded relief images of each state in the U.S. Click a state and see its elevation. You can also download a JPG. It’s as simple as that.
Where is a map of population
Here’s a pretty good one – https://usmaps.com/us-population-density-map/
I want to learn Cambodia elevation
Have you checked our list of global DEM datasets? https://gisgeography.com/free-global-dem-data-sources/
What is the highest elevation?
Where can I find the lowest elevations in all 50 US states?
Death Valley
FYI: for the third map (US Physical Map), the number for the height of Slide Mountain (in the Catskills of New York) is the height in feet, but it is labeled meters.