QGIS Tutorial: How To Use QGIS 3
Hold onto your compasses because our QGIS tutorial will give you a blueprint of how to use QGIS 3 (which is ranked as our #2 GIS software)
This QGIS tutorial isn’t for advanced users.
Instead, we’ll cover all the QGIS basics like symbolizing, editing, and using print layouts. Let’s get started.
How to download QGIS 3
Built on the shoulders of the open source GIS community, you can download QGIS at its central hub.
It’s available for all major operating systems like Windows 32 and 64-bit and also Mac.
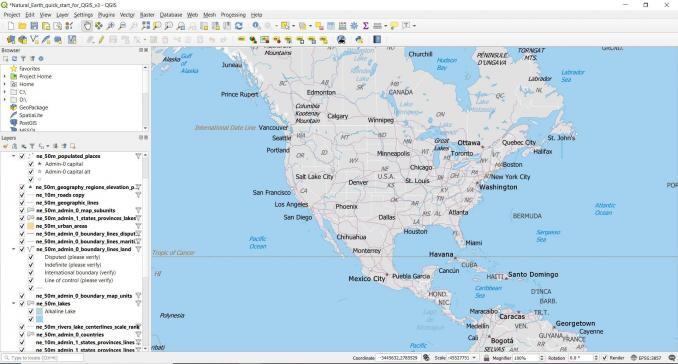
In this QGIS tutorial, we’ll use Natural Earth data because it has a quick-start kit for you to get started quickly.
If you want to learn more about this data package, read more about Natural Earth data.
The QGIS user interface
Here are some of the key pieces to the QGIS user interface.
MAP CANVAS: When you start QGIS, the large window, front and center is the map canvas. The map canvas displays all of your map features. Scrolling the wheel on your mouse up and down will zoom in and out. Holding the wheel on your mouse down will pan left, right, up, and down.
DATA BROWSER: The panel on the left is for browsing and managing your GIS data. It’s like Windows Explorer for GIS data for adding layers to your map canvas. You can move and dock panels on either side. It’s completely customizable and up to you where you want to dock it.
TOOLBARS: Toolbars are specialized sets of tools located above the map canvas. You can undock and move them anywhere in QGIS 3. For example, these are the standard toolbars that are in a QGIS install:
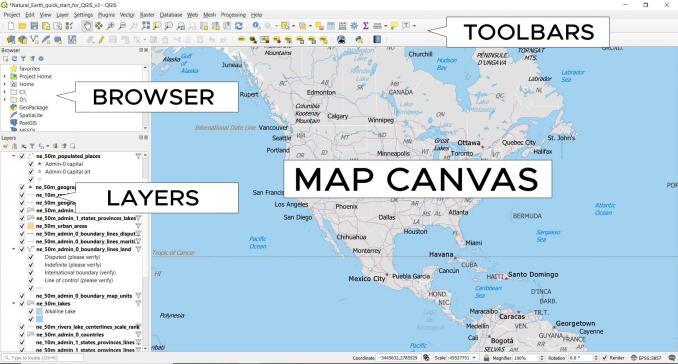
QGZ File: When you save your project, it will create a file with a QGZ extension. In QGIS 2, it was the QGS file. Now, it’s the upgraded QGZ file. The advantage of this file type is that you can open it like a TXT file.
Creating data in QGIS
If you want to create points, lines, and polygons, then you can make a new shapefile to store these features:
- First, start by right-clicking the folder you want to create the shapefile in the Browser panel.
- Then, select New ▸ Shapefile.
- Next, choose the feature geometry as points, lines, or polygons.
- Finally, select the encoding type and coordinate reference system.
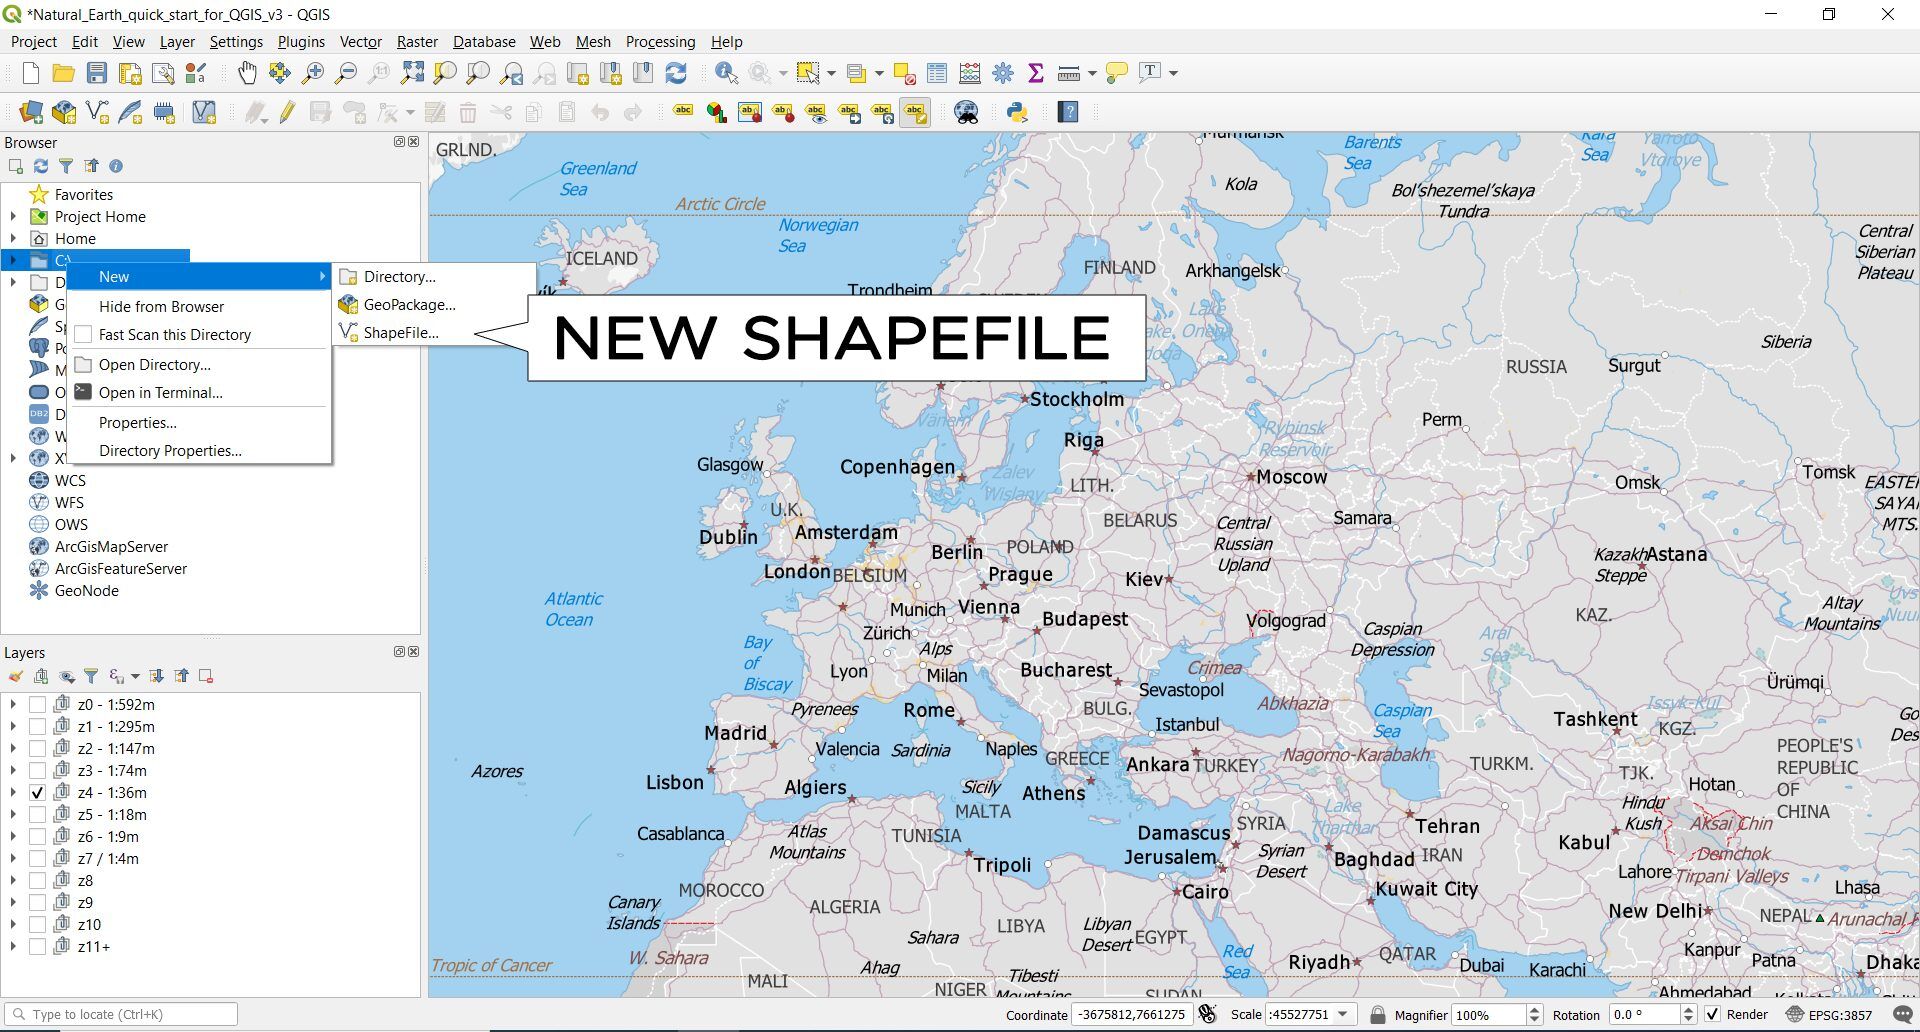
When you click OK, it will prompt you to name the shapefile. Once you assign it a name, it automatically goes into your layer list.
Keep in mind there are other GIS formats for storing data. For example, you can use a Geopackage (GPKG), which is an SQLite database file.
Editing data in QGIS
If you want to edit a layer, first select, and highlight it in the layer panel. Next, click the Toggle Editing tool in the Editor toolbar. From here, it enables the editing tools.
Next, you can add vertices by using the “add point” or “vertex tool”. Clicking on the map canvas adds vertices to geometry.
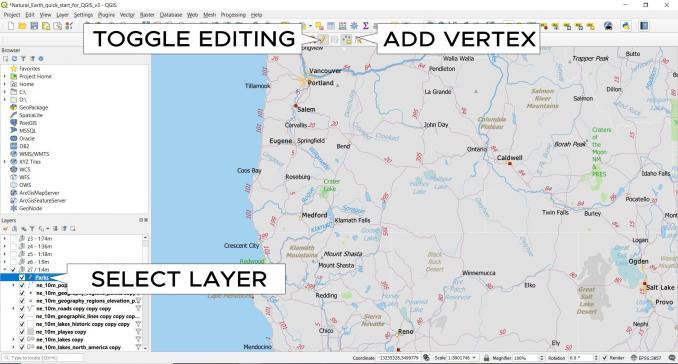
If you want to finish geometry, you can simply right-click on the map canvas. From here, you can fill in the attributes. If you want to save your edits, click the “Save Layer” button.
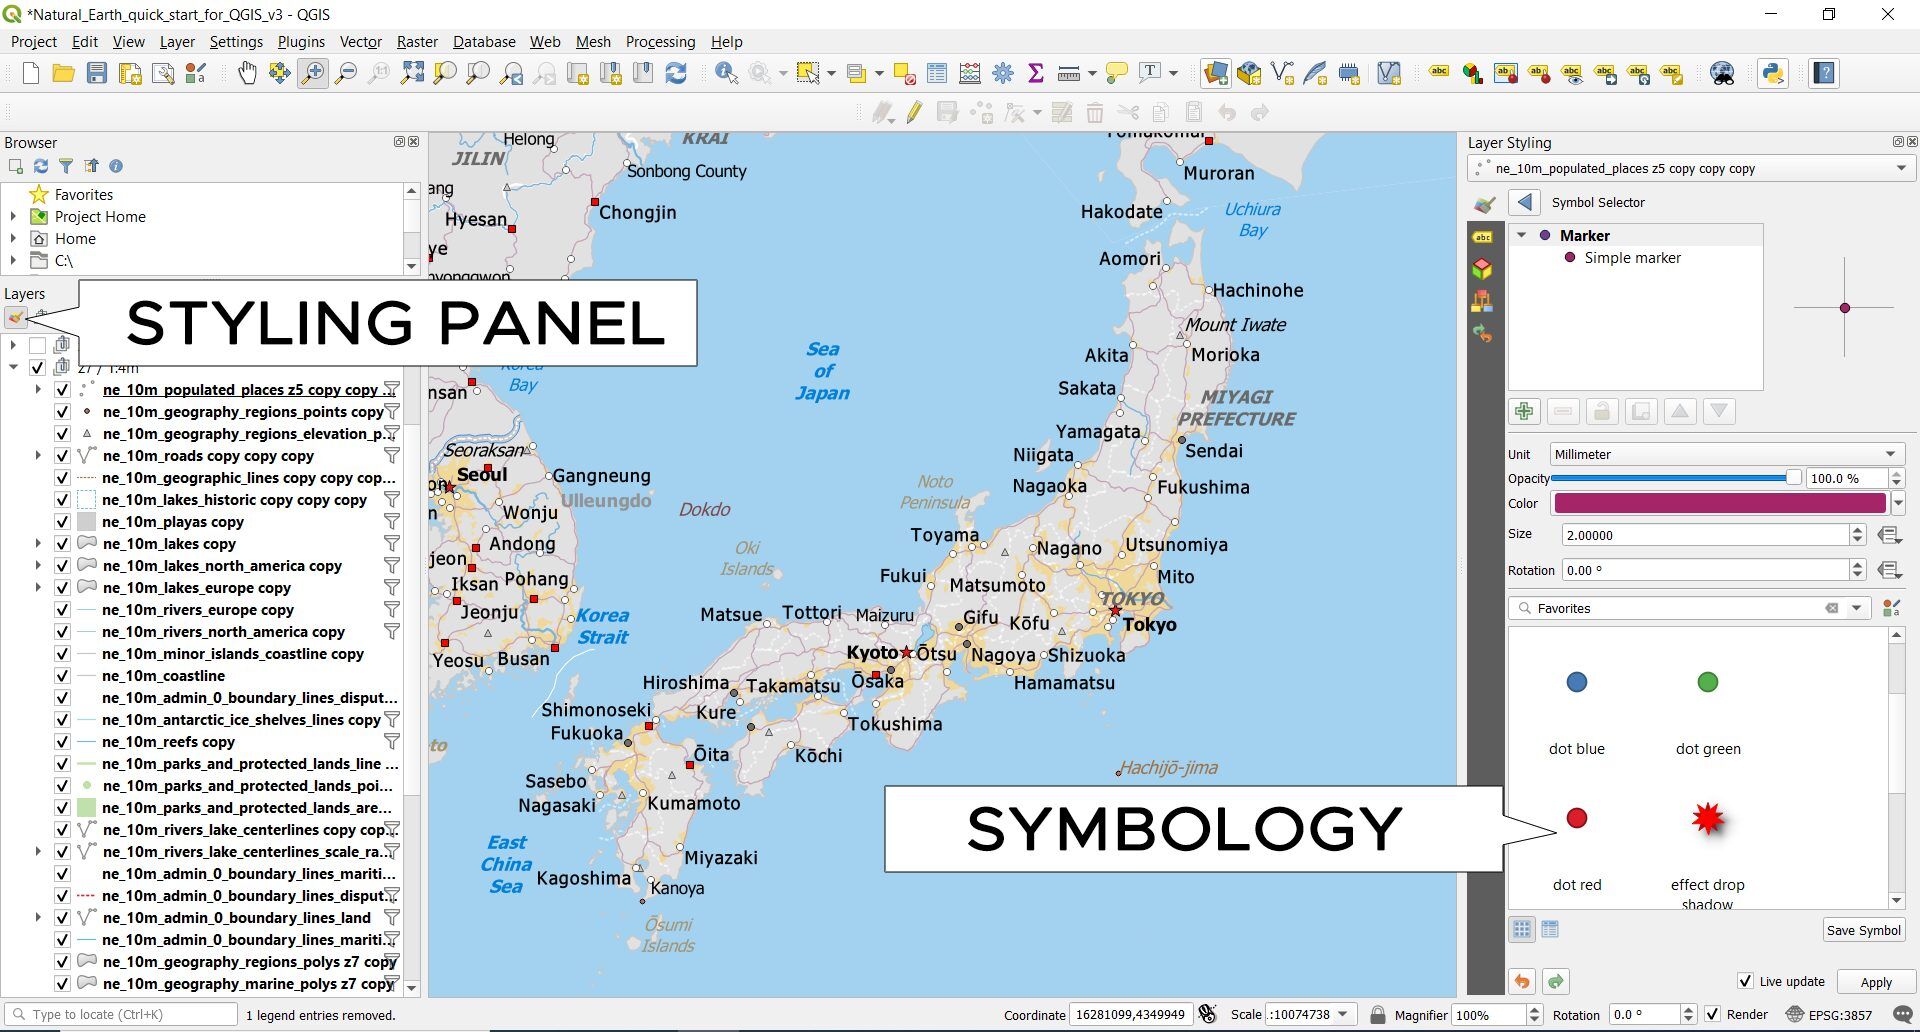
Adjusting symbology in QGIS
If you want to adjust the symbology, QGIS has a shortcut to access the layer styling. By clicking the “layer styling” button, the symbology panel opens on the right-hand side.
In the layer styling panel, this is how you can change the symbology styles. You can also create points, lines, and polygon symbols by adding several together.
In the labels tab, you can decide which label styles to use. You get stylish labeling options in QGIS 3. For example, you can use halos, transparency, and drop-shadows.
You can also adjust the transparency of features on the map. Optionally, you can save it as a style file for later use.
Using print layouts in QGIS
Print layouts are almost like a secondary interface. It’s how you make a professional quality map. It’s also where you add common map elements like north arrows, scale bars, and titles.
- First, click Project ▸ New Print Layout.
- Next, enter a name for your layout.
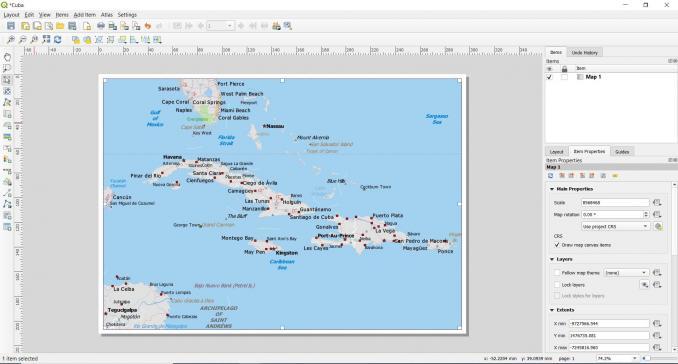
- Click Add Item ▸ Add Map
- Then, drag an area in your canvas.
- Use Edit ▸ Move Content to pan in the map window
- In the Item Properties tab, you can set the map scale, extent and even rotation of the map.
- By clicking Add Item ▸ Add Scalebar, it adds a scalebar.
There are options for adding labels, legends, and north arrows so you can test what everything does. This is also how you will create a 3D map, which is something completely new to QGIS 3.
Print layouts supersede their predecessor print composers from QGIS 2. Luckily, they have similar functionality and interface.
Exporting maps in QGIS
As explained above, print layouts are for exporting and printing professional-quality maps. It’s in the composition panel that you set paper size, orientation, units, and background color. If you want to export a PDF map in QGIS, click the following:
Layout ▸ Export as PDF.
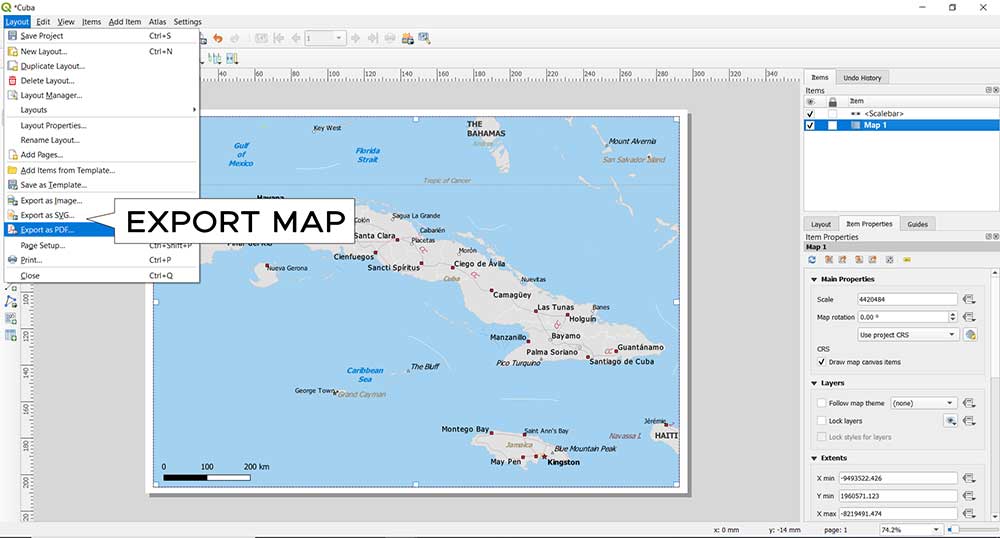
If you export as SVG, this gives you the option to import the map in Adobe Illustrator. You can also export maps in a wide range of formats like JPG, PNG, and TIF.
Running geoprocessing tools in QGIS
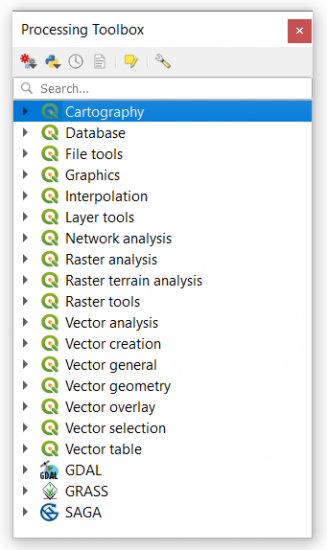
You can access the GIS processing tools by clicking:
Processing ▸ Toolbox.
If you want to find a specific tool, the easiest way is to search for it. The search bar at the top helps you to locate the tools you need from over 600 available tools.
The last 3 toolboxes belong to separate free and open source GIS software. By adding GDAL, GRASS GIS, and SAGA GIS toolboxes, you get even more specialized tools like in fields such as geosciences and geostatistics.
Downloading plugins in QGIS
QGIS plugins are the lifeblood of analysis. In fact, there are about 500 plugins available in the QGIS repository. The number of plugins is growing every day. Here’s how to download a plugin:
Plugins ▸ Manage and Install Plugins
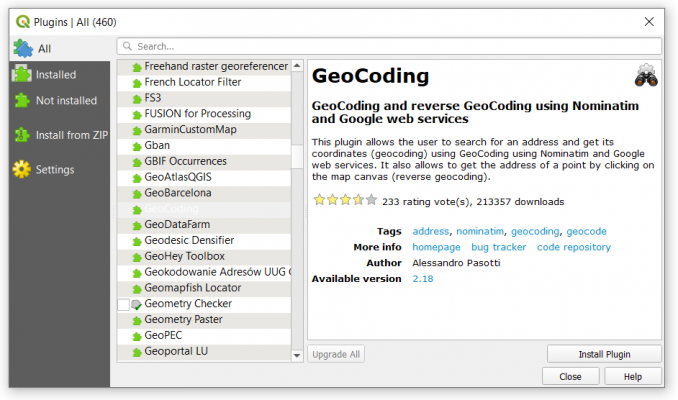
This will open the plugin manager where you can download, update, activate, and deactivate them. For example, these are some of the popular plugins
- CAD TOOLS: Performs CAD-like functions in QGIS
- GEARTH: Displays QGIS view and features with attributes into Google Earth
- PROFILE TOOL: Plots profile lines from elevation raster layers
- GEOCODING: Allows users to search for an address and get its coordinates
Make sure you take full advantage of QGIS plugins. Whether you’re looking to build web maps or perform remote sensing classification, QGIS plugins can boost its functionality.
Adding a basemap in QGIS
Basemaps are background, non-editable, georeferenced images that give a point of reference on a map. In this QGIS tutorial, we’ll use the QuickMapServices.
First, search for QuickMapServices in the plugin manager. Then, click the Install Plugin. After the plugin installs, it will be available to you in the top menu bar.
Go to: Web ▸ QuickMapServices Plugin.
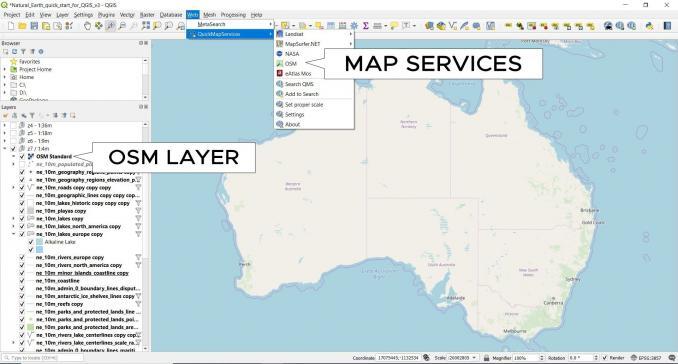
By selecting a layer from the drop-down menu, you can add it to the map canvas. For example, you will see different layers to choose from including:
- OpenStreetMaps (Topographic, Cycle Map, Landscape, and Public Transportation)
- Landsat
- NASA (Forest Fires, SEDAC)
- MapQuest (Aerial, OSM)
If you want to add Google and Bing base maps, you can go through the settings and click “More Services”. From here, you click “Get contributed pack”. After downloading the contributed packages, you will be able to use web services from Google and Bing.
READ MORE: How To Add Basemaps for QGIS with QuickMapServices
3D visualization in QGIS
First, you’ll need a digital elevation model (DEM) for this QGIS tutorial. If you don’t have one, you can download one from our list of 5 DEM sources.
If you want to drape an orthoimage on top of your elevation model, here are 15 free satellite imagery sources for downloading. For instance, here’s an example of a realistic 3D model view of Ayers Rock in Australia.
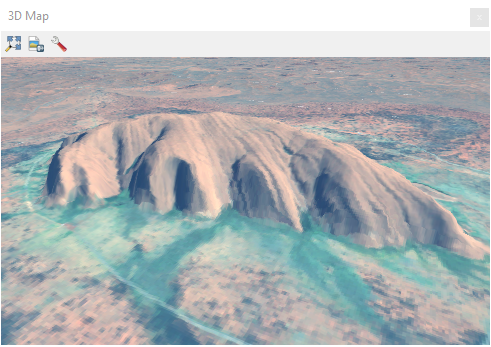
USGS Earth Explorer is also a great source for both elevation and imagery data. Check out our guide for how to download imagery from USGS Earth Explorer.
- After you have your data, drag and drop it into the map canvas.
- Click View ▸ New 3D Map View
- By holding down the middle mouse button, you can tilt your map in 3D.
- You can adjust the 3D configuration settings like vertical scale and tile resolution.
By adding your orthoimage to the map canvas, it will drape over your elevation data.
Popular QGIS plugins
QGIS plugins give you extra firepower beyond the traditional processing tools. Plugins are one of the main reasons why QGIS 3 is as powerful as any GIS software.
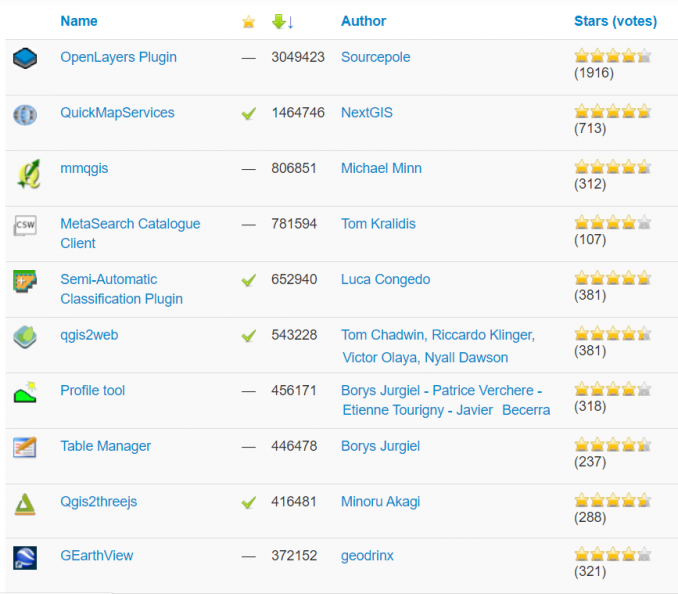
If you rank QGIS plugins by downloads, here are the top 10 plugins that users are embracing:
Summary: QGIS Tutorial
In this QGIS guide, we covered all the essentials.
From adding GIS data to editing it…
From symbolizing to exporting maps in print layouts…
But this QGIS guide has just scratched the surface.
Now, it’s your turn:
Download QGIS today and leverage its plugins. It’s time to map with confidence.


