Service Areas in ArcGIS Network Analyst
If you want to find out just how far your city firefighters, ambulance, or paramedics can service, then you should use the ArcGIS Network Analyst Service Area analysis tool.
For example, the ArcGIS Service Area tool can pinpoint all the streets in a given road network that can be reached (isochrone map) from a start point facility in an allotted amount of time.
How valuable is this information for a city, town, or district?
Well, it could just be the deciding factor for where the next fire station, police station, or hospital is built. Find out how to perform a “Service Areas analysis” in ArcGIS in this helpful guide.
How to Create Service Areas (Isochrone Maps)
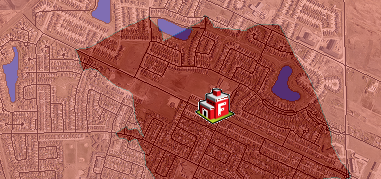
The output of this “Service Area” tutorial will show you exactly how far a facility can service in a road network. The output is a polygon or line connecting points at which a city service arrives at the same time.
We’ll walk you through how to prepare the data and how to load the facilities into the Service Area analysis problem. This means that each facility will have its own service area – or the extent for how far firefighters can reach in a given amount of time (isochrone).
We will go through how you can run different scenarios – including setting up lengths and time. This will tell you exactly how far a facility can service.
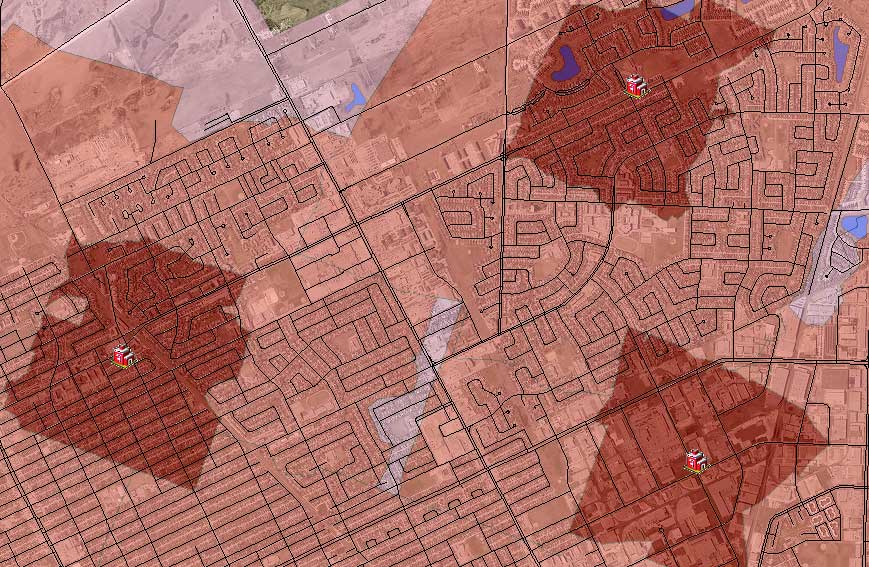
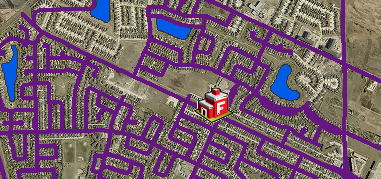
Lastly, we’ll talk about adding impedance and changing some of the other settings, The final result of this tutorial will look like this – with each thematic color indicating a different service area for each condition.
What You Will Need
This Service Area tool tutorial leverages the power of networking in ArcGIS. You will need to flick on your Network Analyst extension by clicking Customize > Extensions > Network Analyst.
You will need a solid road network. A road network isn’t just any line data set. It’s built using the Build Network tool. This will create all the necessary nodes for intersections and connectivity.
Lastly, you will need a data layer with facilities.
A quick recap of what you will need:
- Network Analyst Extension
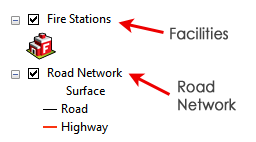
- Road Network
- Facilities Layer (Fire stations, police stations, hospitals, etc)
Here’s a tutorial on how to find service areas.
Step 1. Turn on Network Analyst
Before you begin in ArcMap, flick on the network analyst switch.
Add your clean topological road dataset and facilities to the Table of Contents (Data Frame)
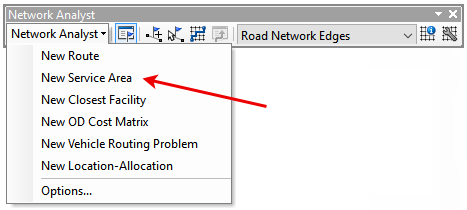
Step 2. Create a new service area
In the network analyst toolbar, select the New Service area tool by clicking Network Analyst > New Service Area.
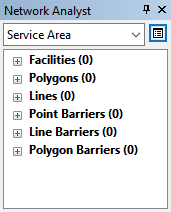
At this point, you will see the Service Area analysis window appear in the Table of Contents.
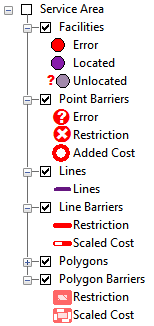
The Service Area analysis will also show up in the Network Analyst window with its six network analysis classes—Facilities, Lines, Polygons, Point Barriers, Line Barriers, and Polygon Barriers.
Note: If you cannot see the Network Analyst window, click the Network Analyst Window icon in the Network Analyst toolbar.
Step 3. Add facilities
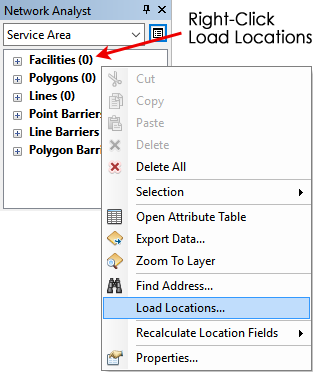
Add your facilities in the Facilities(0) in the Network Analyst Window. Right-click Facilities(0), and select the Load Locations… option:
Locate the file that you want to load from. From here, you have some extra options you can configure:
- Name: Name is the title that will appear in the Network Analyst window.
- Curb Approach: This property tells you which side of the road a vehicle may depart from the facility. The default is either side of the road, meaning the service area can depart on the left or right side.
- Attr_Length: This property is the amount of delay before this facility can service an area. For example, if one facility has a delay of 2 minutes, in a service area study for 5 minutes – it would only have 3 minutes of the allotted time for how far it can reach. This facility has more impedance compared to another station that has a delay of only 1 minute.
- Breaks_Length: For your service area study, you can analyze different amounts of times or lengths. For example, at one facility you may want to have a break of 5 minutes and 10 minutes [5, 10]. At another facility, you may want to have breaks of 3 minutes, 7 minutes, and 12 minutes [3, 7, 12]. The resulting polygons in the service area study will be how far a facility service can reach as specified by the breaks field.
Step 4. Fix errors
After loading the facilities in the Network Analyst Window, the facilities will no longer have an empty value of zero. If you loaded in 30 facilities and they loaded correctly, then the Network Analyst Window should be as follows: Facilities(30)
But if you have any errors or unlocated points when you load your facilities then it will be shown in the symbology of your facilities layer in ArcGIS.
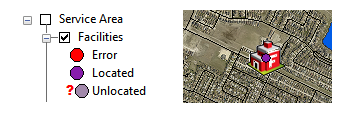
Check for errors. Reload your facilities to ensure they are all correctly located.
Let’s solve the Service Area problem before discussing barriers.
Step 5. Service Area Set Up
You have your Service Area problem setup. Your facilities are loaded in. It’s time to solve using all the service areas to finally find out the distance they can reach to provide their service. But there’s just a bit more to set up before we push the solve button.
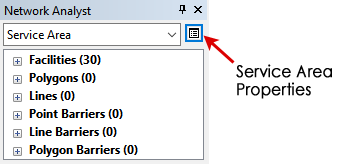
Let’s set up the Service Area properties so we know exactly what the output will be. Click the Service Area properties button:
Analysis Settings
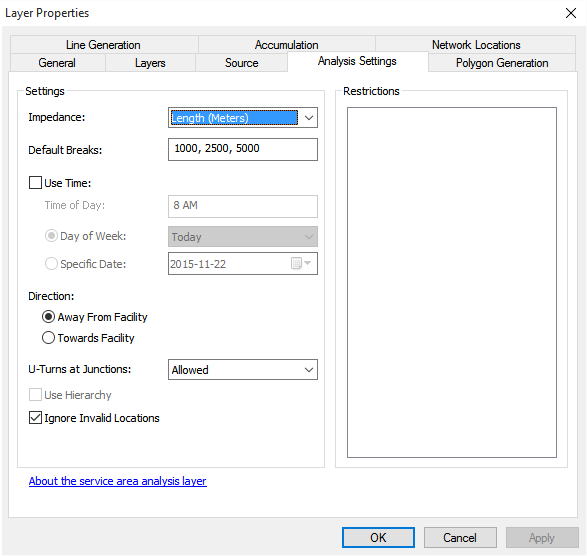
In the Analysis Settings tab, we will set up the impedance, default breaks, and direction.
IMPEDANCE: For impedance, you will typically use a variable time from your network data set. In this study, we will use Length.
DEFAULT BREAKS: The default breaks are all the study buffer polygons you want to create. If you want to find out the distance a facility can reach in 5-minute and 10-minute breaks, then set it up as 5, 10 in this field. In our case, we will use a basic 1000, 2500, and 5000 (in meters) as our study distances.
DIRECTION: The direction tells if the service area is away or towards the facility. We will use away from the facility as we are using fire stations to service areas away from the facility.
Click the checkbox in the Polygon Generation tab
Polygon Generation
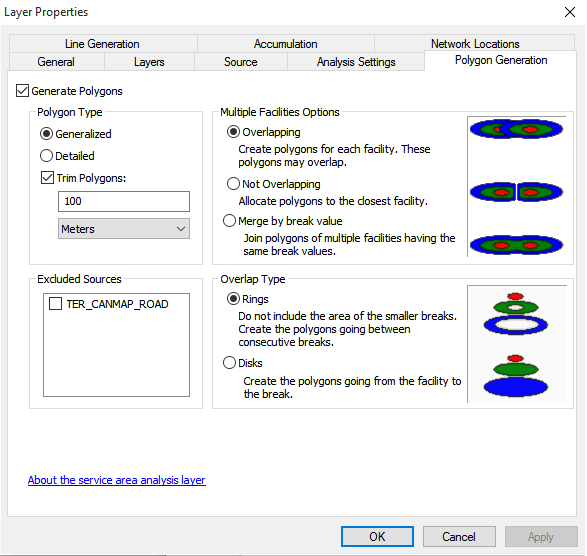
In the Polygon Generation tab, you have options for how the service area polygon distances will be outputted. This represents the area that will be serviceable for each facility.
GENERALIZED: Generalized polygons are quickly generated with reasonable accuracy.
DETAILED: Detailed polygons are generated with more accuracy but it takes longer to build.
TRIM POLYGONS: This means that the edges will be trimmed down.
You have options to create “overlap”, “merge”, “generate rings” and “disks” using the other options in the Polygon Generation tab.
Click the checkbox in the Line Generation tab.
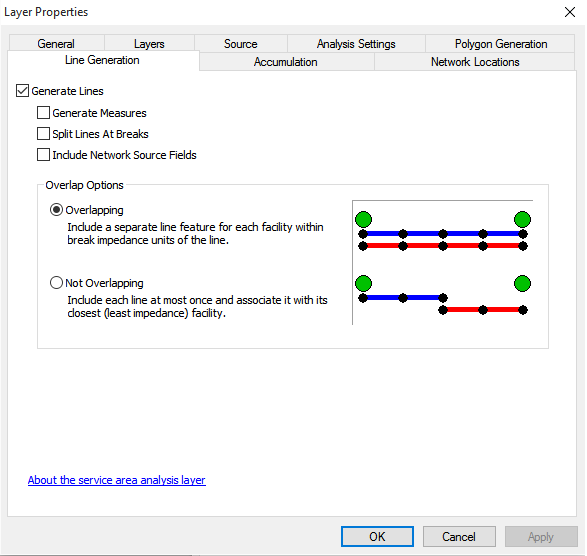
Line Generation
The Line Generation tab is how to set up the reachable areas in a network dataset determined by the impedance parameter. Service area lines are more representative of service areas because they show you exactly how far a facility can service.
GENERATE MEASURES: Adds measures to your output lines using linear referencing
SPLIT LINE AT BREAKS: Creates a break where lines intersect.
INCLUDE NETWORK SOURCE FIELD: Adds the source, from, and to fields from your network dataset into output.
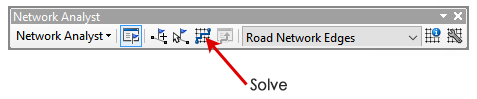
Step 6. Solve
Now that you have set everything up, it’s time to Solve each one of our Service Areas.
As long as you followed the steps correctly, you can now push the solve button in the Network Analyst toolbar.
This tool will generate Service area polygons using each break that you set up:
It will also produce Service area lines based on your criteria:
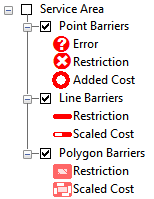
Setting Barriers for Service Areas
Although not always necessary, you can design point barriers, line barriers, and polygon barriers in your service areas study. Barriers serve as restricted areas prohibiting travel or adding a scaled cost in a network dataset.
An example of a polygon barrier is a construction zone that has closed off a street entirely. If you want to add barriers, you would load a restriction or scaled cost barrier in the polygon barrier.
We don’t go into detail about setting barriers, but you can find more information in ArcGIS help.
Solving the Reachable Distance Problem with Network Analyst
The ArcGIS Network Analyst Service Area analysis tool is perfect for finding out just how far your city firefighters, ambulance, or paramedics can service.
How far can a facility reach from a start point facility in an allotted amount of time?
This information is valuable for city planners who want to know where to build their next hospital, fire station, police station, or bus station.
Let us know how you are using ArcGIS network analyst and Service Areas in our comment section below. Don’t forget to check out the ArcGIS Pro Service Areas documentation for more information.


How do you fix “Unlocated” facilities? I just have 4 cities. Ran it once, it worked fine. Added another city and loaded into the facilities but it says unlocated. Cannot resolve this. Thanks.
It needs to go into a network dataset beforehand similar to all the network analyst tools. During this process, the network dataset may correct some of the inconsistencies in the road network. From my experience, you’ll need a well-built road network to get any of the network analyst tools working.
Hi. Just one question: its possible to determine service area using network road without topology?