MAUP – Modifiable Areal Unit Problem

DEFINITION:
MAUP (Modifiable Areal Unit Problem) is a source of statistical bias that happens when spatial data is grouped differently, leading to different results from the same data.
What Is the Modifiable Areal Unit Problem (MAUP)?
The modifiable areal unit problem (MAUP) is a statistical bias that occurs when you aggregate point data. There are two types of biases for the MAUP:
- Scale effect
- Zonal effect
The Modifiable Areal Unit Problem (MAUP) is an issue in GIS where the results of spatial analysis can vary based on the arbitrary delineation of geographic units, highlighting the sensitivity of analysis to the choice of spatial boundaries.
Scale Effect
The scale effect occurs when maps show different analytical results at different levels of aggregation. Despite using the same points, each successive smaller unit consequently changes the pattern.
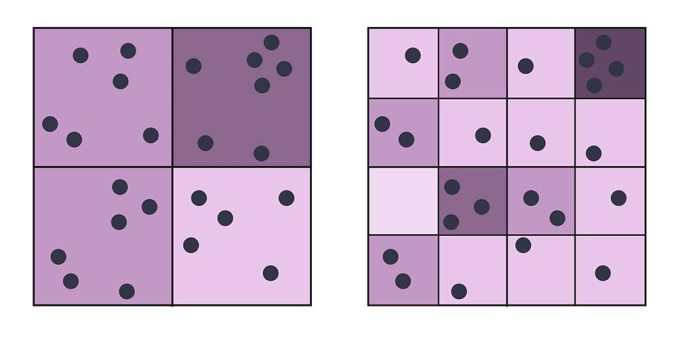
The scale effect can yield different results based on the size of the boundary. As you move from higher to lower aggregation levels yields different results, each level of aggregation paints a different picture.
Zonal Effect
The zonal effect occurs when you group data by various artificial boundaries. In this type of MAUP error, each subsequent boundary yields major analytical differences.
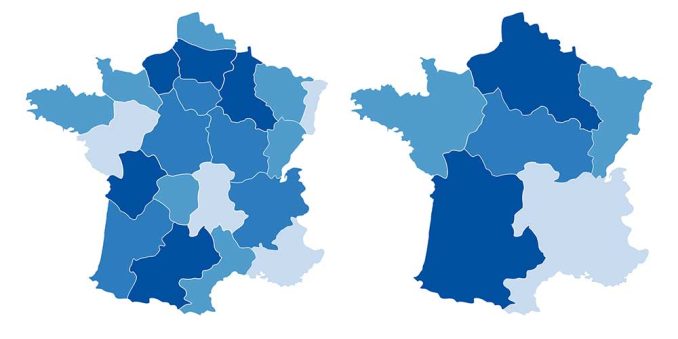
For example, here are points aggregated at a county level. But when you aggregate at a state level, it produces different visible results.
Gerrymandering and Redistricting
The zonal effect can occur by accident or on purpose. For example, this can occur when a political party wants to favor an election by
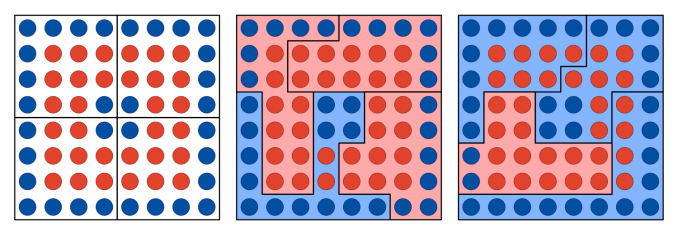
As an example in the diagram above, you can manipulate any of the political boundaries below to favor either blue or red. This is how to rig an election so it’s in favor of one political party.
Gerrymandering – Manipulation of electoral districts for political gain.
Redistricting – Changing the boundary lines for electoral districts such as with the Esri Redistricting extension.
Conclusion
The Modifiable Areal Unit Problem (MAUP) occurs by aggregating data and representing it with bias at different scales or boundary extents.
Despite being essentially an unsolvable issue, you can help map readers by:
- Stating the scale of aggregation.
- Representing it at multiple scales simultaneously.
As described in the book “How To Lie With Maps”, mapmakers – consciously or unconsciously – can present only one of many possible stories about the places it depicts.


