R Programming in GIS

R Programming in GIS
R programming is a free, open-source language for statistical computing and data visualization. Statisticians use it for everything from exploratory analysis, and data mining to graphing.
But lately, GIS users are leveraging its capabilities for much more specialized types of statistical analysis and data manipulation.
Despite how ArcGIS and QGIS are mostly Python-based, both have extensions to work with R. This article will teach you the basics of how to integrate R programming with GIS.
Further to this, we will also discuss how to use R and GIS together to help with data collection, data processing, and modeling.
Integration of R libraries
The usage of R in GIS is growing because of its enhanced capabilities for statistics, data visualization, and spatial analytics. Here are some important fields that often require the use of R.
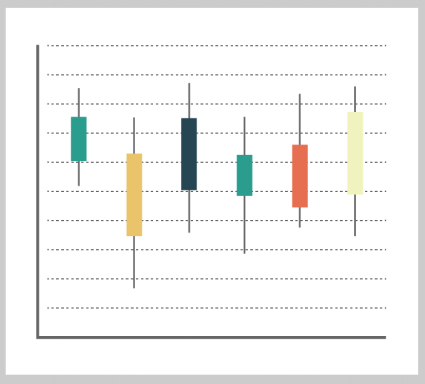
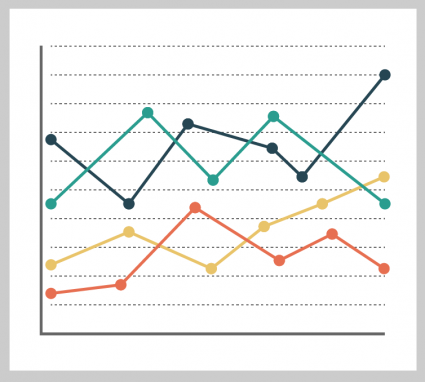
Data Visualization – By leveraging packages like ggplot2, GIS users use R mainly for statistical analyses and plotting data. There are various mapping and data visualization packages like tmap and ggplot2. If you’re already familiar with these tools, they’re fairly straightforward for visualizations.
Table Operations – You can perform some powerful table operations with both Python and R. But you can’t underestimate some of the packages available in R. For example, tools like dplyr are intuitive to use and give flexibility for data manipulation.
Data Support – Not only does R support spatiotemporal arrays (data cubes), but it also supports tools like tidycensus to obtain census bureau data. For anyone working with government data, R offers a package to help with these types of trivial tasks.
In total, there are 12,700+ available packages as part of the R Project for you to work with, from graphing to data management and data visualization.
Why not use Python?
While Python can do most of what R can do, we typically can use a two-pronged approach in GIS. Because you can do most work in both languages, it usually comes down to whatever you feel most comfortable using.
While R is good at visualization and statistical analysis, Python is particularly good at working with file systems, networks, web scraping, and automation.
This is why Python is the default programming language for QGIS and ArcGIS, instead of R. While Matplotlib is an alternative to ggplot2, some data analysts prefer one over the other.
You can use both R and Python to make maps. Albeit, most are rudimentary without capabilities to customize them as you can in GIS software. But they’re still functional maps. For more advanced spatial analysis, there are libraries like PySal such as detecting clusters, outliers, and hot spots.
How can you use R in GIS?
It’s becoming more common practice to use R within your GIS workflow. Whether it’s for computational analysis or data visualization, there always seems to be a usage of R.
But how do you leverage R?
It turns out that there are several ways you can bridge R into GIS. And here are a couple of the ways that enable you to do so in both QGIS or ArcGIS.
R-ArcGIS Bridge
The purpose of R-ArcGIS Bridge is that you can store your vector and raster data in ArcGIS. Then, you can directly access it in R and return R objects back into ArcGIS native data types.
At the same time, you can also use powerful spatial analysis and visualization tools in ArcGIS and seamlessly go back and forth to R. This makes it ideal for R and ArcGIS users to use in R Notebooks.
Processing R Provider (QGIS)
If you’re looking for an open-source GIS software solution to leveraging the open-source statistical language of R, then the Processing R Provider is likely what you’d be looking for in QGIS.
This plugin allows you to write and run R scripts natively inside QGIS. In order to use this plugin, you will have to install R on your machine with the correct R packages added beforehand.
Geospatial Modeling Environment (GME)
The Geospatial Modeling Environment (GME) was an add-in for ArcGIS. Unfortunately, this package suddenly went offline. Keep your eyes open for this add-in as the developer has a solid history of developing useful suites of tools such as Hawth’s Tools for ArcMap.
R Programming in GIS
R is an open-source programming language used to analyze large sets of data. It’s popular in many fields, including data science, statistics, biology, ecology, economics, and much more.
When used in combination with GIS, it can be a powerful tool for spatial analysis and extension for statistical computing.
In this short tutorial, we explored the practical ways you can use R libraries in your GIS workflow for everything from data analysis, graphics, and visualization.
How do you use R in geospatial analysis? What are some of its advantages and drawbacks to Python? Please let us know with a comment below.


This is interesting just as I wish to explore the capabilities of R in ArcGIS!!
Salut chers tous.
J’aime beaucoup me perfectionner dans ce domaine de SIG et R. En passant en revue ce website c’est vraiment intéressant dans dans ce dernier.