Space-Time Cubes: Stack Time Like Lego
What are space-time cubes?
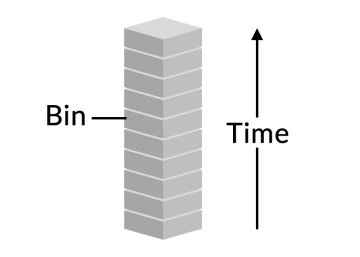
Space-time cubes show how phenomena change over time within geographic space. In a space-time cube, each cube represents a slice of time.
For example, top cubes have newer timestamps. Whereas bottom cubes have older timestamps.
By looking at the slices of time from bottom to top, you can see a temporal change in that geographic area.
Let’s take a look at some of the patterns you can see for this type of 3D analysis and visualization. Also, let’s think of some examples of when it is appropriate to use space-time cubes.
Space-time cubes example
You can aggregate points by counting how many points fall into each bin. Typically, bins are cubes. Hence, this is why we call them space-time cubes. But they can be anything such as hexbins or counties.
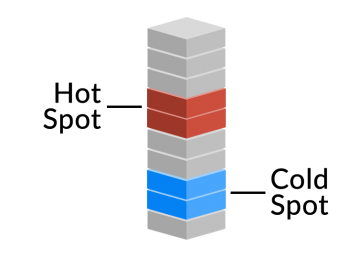
If you look at the symbology, we often use red to represent hot spots. Whereas, it’s common to use blue for cold spots.
For example, you have a set of points that represent crime locations. A space-time aggregates the number of crimes for each month.
Sequentially, every other month is stacked above using their respective values. This means you can observe how crime changes by looking out for hot spots in a series of space-time cubes.
Hot and cold spot patterns
The goal is to understand if there are any patterns in the underlying data. The Getis-Ord G* statistic finds trends in the data by comparing it to neighboring bins.
Patterns can be anything from:
- New hot and cold spots
- Intensifying hot or cold spot
- Sporadic or oscillating
Overall, it’s a neat visualization that incorporates both space and time. It’s easy to see the temporal change in a geographic area by looking at the stack of space-time cubes.
Examples of Space-Time Cubes
Anything that has time and geography associated is either a bunch of point features for aggregation.
- Vegetation health such as NDVI over time
- Poverty rates change
- Outages in electricity
Here is an example of a space-time cube web scene in ArcGIS Online (AGOL).
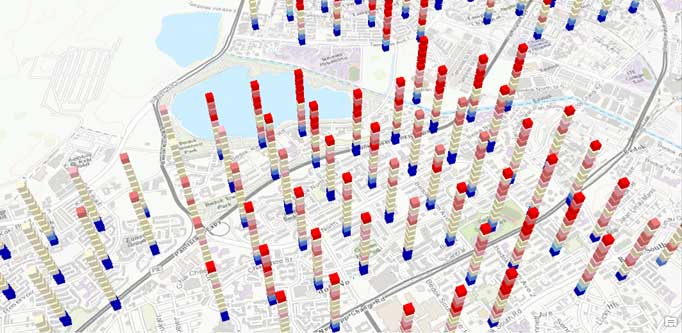
The idea is that you start with a NetCDF, and then the tool aggregates their spatial location into bins. Then, you can package it up in a web scene for users to view and consume.
Space-time cubes in 4D
To recap: The purpose of space-time cubes is to incorporate both a temporal and geographic component.
Go up the stack of cubes, and see how things change in time. Older cubes are on the bottom. Newer time stamps and on top. Stack blocks like they’re Lego.
When you put it in a 3D environment, you get a 4D space-time cube in a way. Finally, use it to find patterns that emerge based on color.
Neat concept? Yes. Is it practical? Well, why don’t you let me know? Do you use space-time cubes in your geo-visualization toolset?


What is the benefit of the 3D time cube analysis versus the getis-ord 2D visualization? Because in 2D, I can see the change over time too (it’s displayed as e.g sporadic hotspot) right?