Learn Synthetic Aperture Radar (SAR) by Example
Synthetic Aperture Radar (SAR) Basics
Synthetic Aperture Radar (SAR) is an emerging technology in remote sensing.
In fact, Sentinel-1 is equipped with this active type of sensor. Likewise, Radarsat and TerraSAR use synthetic aperture radar.
The main advantage of this technology is that it can synthetically produce higher-resolution images in any weather condition and even at night.
Today, we don’t intend on getting into precise details about how this technology works. Instead, we will interpret SAR imagery with basic examples and give some real-world applications.
SAR’s Bat-Like Capabilities
It’s said that synthetic aperture radar is similar to how bats use echolocation to navigate in a cave.
When bats fly in a cave, they use sound to navigate. Generally, they create sound waves from 50 to 120 dB. When this sound bounces off a wall and returns to the bat, it understands distance based on the echo.
In general, the same principles apply to SAR. The satellite sends microwave pulses to Earth. The pulse returns back to the satellite and the sensor makes an image from the returned echoes.
Generally, synthetic aperture radar is side-looking. This means they don’t look completely down at Nadir but at an angle. There are advantages to this type of viewing angle which I will mention below.
As mentioned earlier, microwave radar can be seen at night and through clouds and smoke. At any time of the day or in any type of weather condition, SAR works.
Actually, longer wavelengths can penetrate clouds better and even the ground. For example, L-band (~24 cm) radar has longer wavelengths than C-band (~6 cm) and X-band (~3cm). Learn more about Radar bands here.
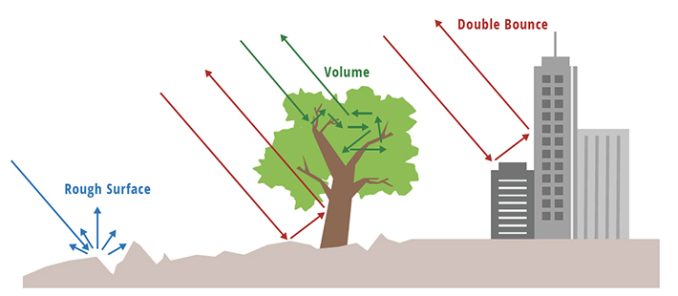
Types of Radar Scattering
Side-looking radar interacts with different types of terrain. The 3 main types of scattering mechanisms are:
- Specular
- Diffuse
- Double-bounce
First, we will provide a schematic for each type of scattering. After, we will give an interpretation of where each type of scattering occurs.
Smooth Surface
Smooth Surface reflection comes from flat terrains like roads or water. For this type of scattering, very little energy of the transmitted pulse returns to the sensor.
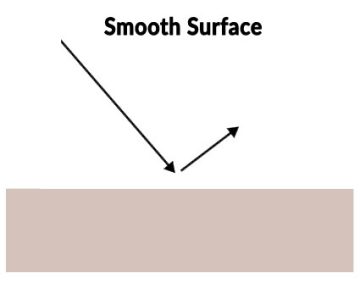
In this example, pixels will typically appear black typically with values less than -20dB. Smooth surface reflection resembles the behavior of a mirror. It can also be helpful in the detection of flooded lands and water characteristics.
Rough Surface
Rough surface scattering such as plowed farm fields and vegetation. Scattering goes in all directions diffusely. For example, typical pixel values will be greater than -20dB and in grey.
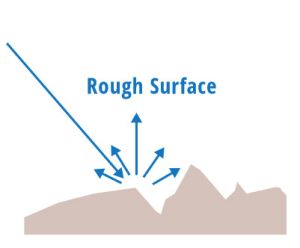
This type of scattering is common in natural environments. It is also useful in distinguishing between different land cover features, aiding in applications like agriculture monitoring and land use classification.
Volume Scattering
Volume scattering occurs when the radar waves penetrate an object that is not completely solid but has many internal layers or scatterers. For example, forests scatter waves in many directions as they hit different parts of the tree.
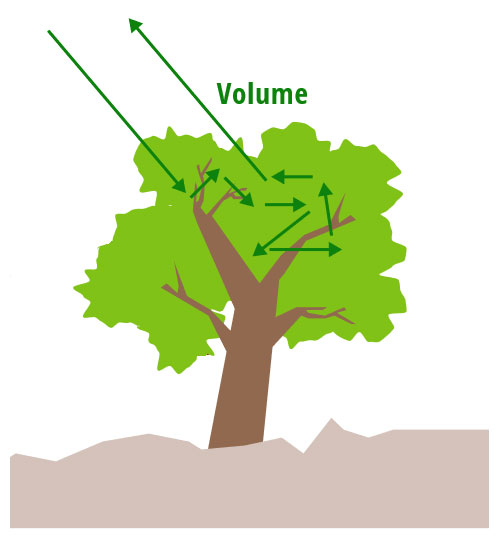
Volume scattering can tell you about the structure and density of an object. In the case of a forest, it can tell us something about the vegetation density, the type of trees, and even the health of the forest.
Double-bounce
Often, Double bounce occurs off structures and man-made objects. The reflected pulse hits one surface after the other and back to the sensor. For example, typical pixel values will appear white with values greater than -10dB.
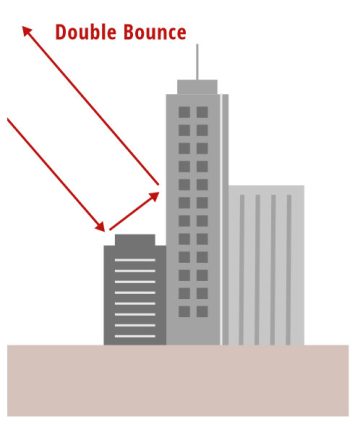
This is particularly important in radar imaging and urban environments, where the double bounce effect helps in the mapping of infrastructure.
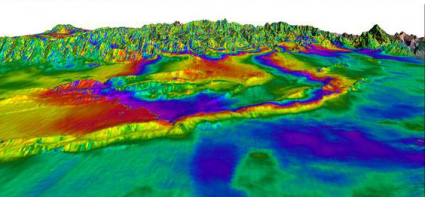
SAR Image Interpretation
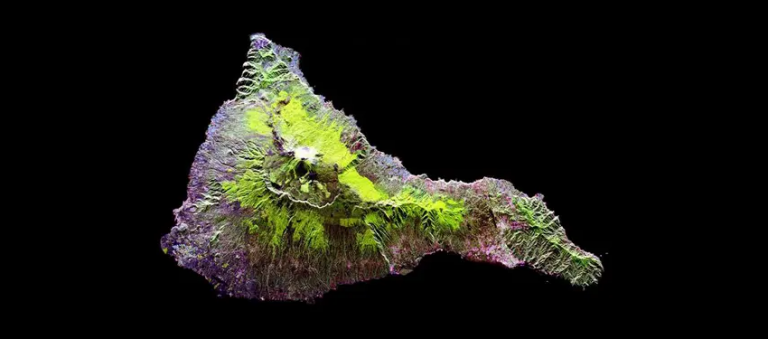
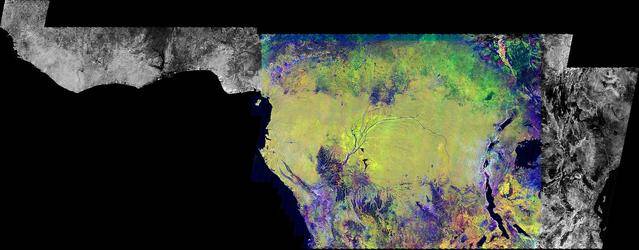
Now that you know the basics of synthetic aperture radar, let’s look at a SAR image with these types of scattering. In this Radarsat-2 example, the image clearly shows all three types of backscatter.
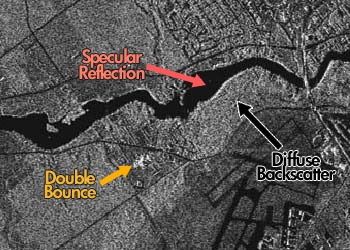
Specular Reflection
In this scene, there is a river that flows in the east-west direction. As shown in the schematic above, very little energy reflects back to the radar sensor. In this case, the pixel is dark with a low dB.
This can also be seen in the southeast portion with the road/airport paved surface. Again, this is a specular reflection off a smooth surface.
Double-Bounce Scattering
On the other hand, the bright white in the center of the image can be interpreted as an urban feature. The radar is receiving double-bounce backscatter, meaning the transmitted pulses are returning to the sensor.
It’s unclear at this scale what this object is but it’s due to double-bounce returns. Because of its values greater than -10dB, pixels will appear as a bright white.
Diffuse Scattering
Finally, the majority of the radar image is rough surface scattering. You have a bit of specular and double-bounce scattering.
This may be from annual cropland, vegetation, grasses, or other features. It is diffuse scattering because there’s not a high or low amount of backscatter in the image.
Synthetic Aperture Radar Use Cases
How can we apply these SAR concepts to real-world applications? There are hundreds of remote sensing applications. Likewise, SAR has applications in the environment, safety, military, and more. Actually, the first one shares the same acronym as SAR (search and rescue).
In search and rescue missions, weather conditions are often poor. In the case of forest fires, smoke could completely block visibility. Because microwave SAR is not affected by these types of conditions, rescuers use it to find man-made objects on the ground. Specifically, it looks for double-bounce scattering where the crash site occurred. Or even where flooding occurs, if there is a specular reflection (dark pixels).
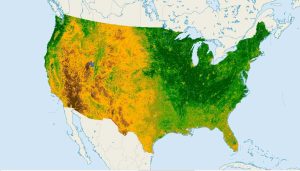
Scientists use synthetic aperture radar to estimate surface elevation with the Space Shuttle Radar Topography Mission inSAR. This satellite used interferometry (InSAR) generating one of the most accurate elevation models of the whole globe. In addition, scientists use InSAR for terrain displacement based on phase differences.
As shown above, SAR is about understanding surface characteristics based on backscatter. That’s why we use SAR during oil spills and to understand ocean waves. During an oil spill, oil floats on water-suppressing waves. This creates a smoother surface, appearing dark in the radar image. But if you were searching for a ship in the Arctic, you’d look for double-bounce or bright pixels in a SAR image.
Lastly, microwave radar is sensitive to the dielectric constant in features. This is why researchers are trying to study soil moisture using synthetic aperture radar. In agriculture, farmers can use this to understand wetness in the first few centimeters of a bare soil profile. Even for mapping wetlands, scientists use the Touzi decomposition technique.
A Little Deeper in the Technology
Polarization refers to the orientation of the radar wave from the SAR antenna. Both electric and magnetic lines of force are at right angles to each other, but it’s the electric field that determines the direction of polarization of the wave. Synthetic Aperture Radar uses an antenna that can transmit in either the horizontal (H) or vertical (V) polarization.
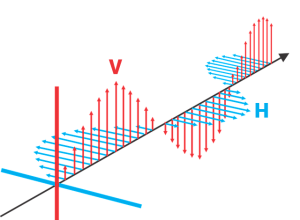
When the electromagnetic wave scatters from a target, the polarisation state of an electromagnetic wave can change. When the sensor receives the returning wave, it measures the degree of change in polarization from the target. For example, it can either be H or V polarization or both simultaneously.
For single-polarization, these are typical transmit and receive pairs.
- HH – for horizontal transmit and horizontal receive
- VV – for vertical transmit and vertical receive
- HV – for horizontal transmit and vertical receive
- VH – for vertical transmit and horizontal receive
The advantage is that you can infer more information about surface characteristics. For example, we can use decomposition techniques like Freeman-Durden to obtain how much surface, double-bounce, and volume scattering in a SAR image.
Finally, it’s synthetic aperture because it can create higher resolution images. Because it receives backscatter along the length of the synthetic aperture radar, it can synthetically generate a higher-resolution image for a point target on Earth.
The entire length of the synthetic aperture radar has the backscatter information for the point target. When all the backscatter information is merged, it’s like a “synthetic aperture”.
Summary: Synthetic Aperture Radar (SAR)
Without experience in radar, it may look like a bunch of pixels. You don’t get a pretty picture used on a map.
Regardless, radar images can be noisy and often require smoothing. But using decomposition techniques and a bit of SAR interpretation, suddenly SAR images become a valuable tool.
If you want to try to use synthetic aperture radar, take a look at our list of 15 free satellite imagery sources.
And don’t forget, there is open source remote sensing software like the Sentinel-1 toolbox to help analyze and visualize SAR imagery.

Very good article that helps us understand how SAR works. Thank you for enlightening me on the subject
Thank you very much for this short and very informative approach!!!
There are a lot of opportunities for near-surface and subsurface data acquisitions with L-band PolSAR and InSAR. Coupled with other technologies like LiDAR — offers unique and valuable insights and decision-making data.
Can oil pipelines be monitored real time with SAR to prevent third party disruption. I work in an oil company in Niger Delta region of Nigeria. We have incessant cases of thieves breaking into pipelines to steal products. Can SAR and Google map help?
Drones are your best bet
Thank you for elaborating SAR in such a way. I am a research scholar pursuing Ph.D., I want to do my research on oil spill detection. Can you please suggest me from where SAR data for oil spill detection can be downloaded.
This is a great article and does a great job of laying out the utility of SAR.
It is quite difficult to compare classification, photogrammetry in LiDAR and Synthetic Aperture Radar. The two sensors use different technology for DEMs.
Sentinel-1 toolbox is a great tool for interferometry, speckle filtering and coregistration.