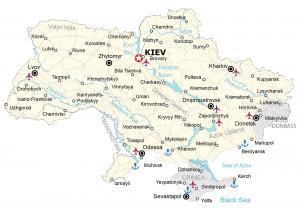
Map of Ukraine
A map of the Ukraine with major cities, roads and water – Ukraine is in Eastern Europe, between Poland, Romania, Moldova and Russia.
A map of the Ukraine with major cities, roads and water – Ukraine is in Eastern Europe, between Poland, Romania, Moldova and Russia.
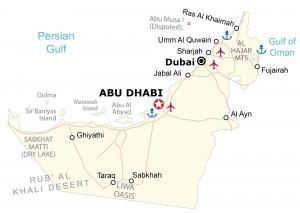
A map of the United Arab Emirates with roads, cities and water – UAE is in the Middle East, bordering the Gulf of Oman and the Persian Gulf.
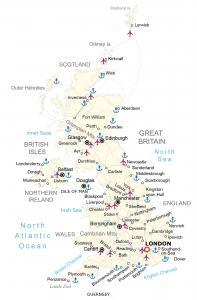
A United Kingdom map with cities, roads and water – UK is an island in western Europe, islands in the Atlantic Ocean, northwest of France.
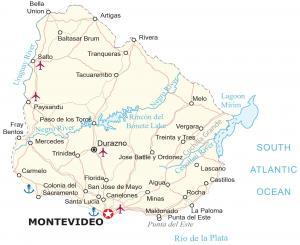
A Uruguay map showing cities, roads and water – Uruguay is located in southern South America between Argentina, Brazil and the Atlantic Ocean.
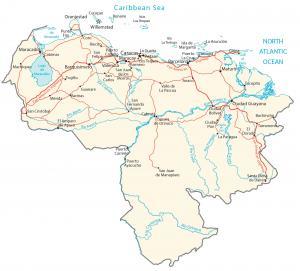
A Venezuela map containing major cities, transportation and hydrography – Venezuela is in northern South America, along the Caribbean Sea.
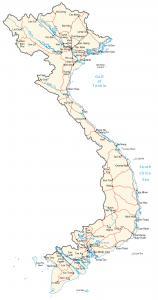
A Vietnam map featuring major cities, roads and water features – Vietnam is in southeastern Asia, bordering China, Laos, and Cambodia.
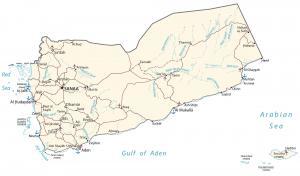
A Yemen map with major cities, transportation and hydrography – Yemen is located in the Middle East between Oman and Saudi Arabia.
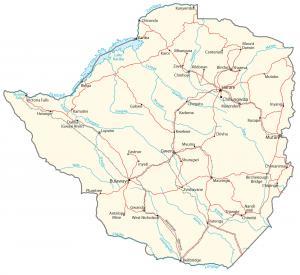
A map of Zimbabwe featuring major roads, cities and water features – Zimbabwe is situated in Southern Africa, between South Africa and Zambia.

Global Mapper by Blue Marble is a 64-bit GIS application. It has a powerful, intuitive interface, especially with LiDAR and terrain mapping.

If you use ArcGIS 10.2 and above, you can use the “Table to Excel” tool to convert a shapefile table to Excel spreadsheet & export field aliases / subtypes