Dot Maps: Map Design with Dots
Dot maps use dots to show the density of a particular phenomenon in an area. More dots represent a higher density compared to fewer dots.
Dot maps use dots to show the density of a particular phenomenon in an area. More dots represent a higher density compared to fewer dots.
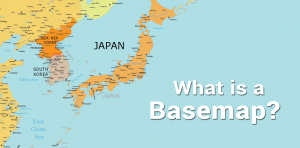
A basemap is a fundamental building block of cartography that provides geographical context to the map and other dataset layers above it.
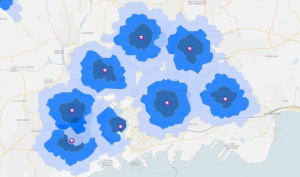
The drive time map is a type of isochrone map that shows you how far you can go based on a start location and an allotted amount of time.
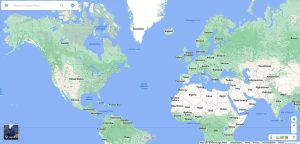
The Web Mercator projection uses a modified version of the Mercator projection and has become a default map projection for web mapping.
Space-time cubes show how phenomena change over time within geographic space. In a space-time cube, each cube represents a slice of time.

In the digital cartography age, it’s easy to overlook traditional paper maps. But they still serve their purpose in our day in age.
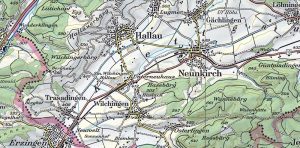
Topographers face an uphill battle of a changing geography. These are the top 10 topographic maps built to meet the challenge of accuracy and completeness.

From cartograms to contour maps, cartographers are like heroes. And every hero has a secret. If you want to build unbeatable maps, here are 25 map types.
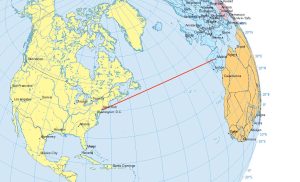
Airplanes travel along the true shortest route in a 3-dimensional space. This curved route is called a geodesic or great circle route.
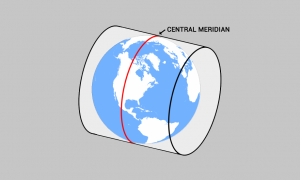
The central meridian is the center line of longitude for projection systems. Projected coordinate systems often use it as a reference point for a x-origin.