The Rise of Machine Learning and AI in GIS

Machine Learning and Artificial Intelligence in GIS
Machine learning in GIS is like giving the world’s most powerful magnifying glass to a cartographer. It enables us to uncover hidden patterns in geographic data, transforming landscapes into libraries of spatial intelligence.
In simple terms, machine learning makes sense out of noisy data finding patterns that you’d never thought existed. Some say it’s like software that writes software.
Instead of applying a pre-built function, ML gains experience through repeated seen conditions and builds a model to apply in new situations.
AI is here to stay. But how can we use it in the context of GIS? Let’s explore this question today.
Types of Machine Learning (ML)
The two broad categories of machine learning are supervised and unsupervised. And they both can apply to GIS applications in various ways. First, what’s the difference between the two?
SUPERVISED LEARNING is just fitting data to a function for prediction. For example, if you plot millions of sample points in a graph, you can fit a line to approximate a function.
UNSUPERVISED LEARNING recognizes what the data is using patterns from unlabelled data. For example, it takes millions of images and runs them through a training algorithm. After trillions of linear algebra operations, it can take a new picture and segment it into clusters.
Most importantly, machine learning is about optimally solving a problem. So it automatically learns on its own and improves from experience.
Lately, GIS is applying artificial intelligence in areas such as classification, prediction, and segmentation. Two of the most popular frameworks are TensorFlow and PyTorch.
1. Image Classification (Support Vector Machine)
When you look at a satellite image, it’s not always easy to know if you are looking at trees or grass… or roads vs buildings. So imagine how hard it would be for a computer to know.
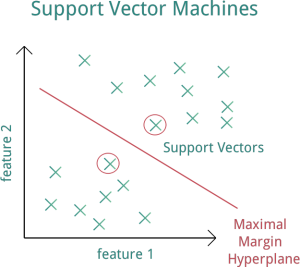
Support Vector Machine (SVM) is a machine learning technique that takes classified data and looks at the extremes. Next, it draws a decision boundary line based on the data called a “hyperplane”. And the data points that the “hyperplane” margin pushes up against are the “support vectors”.
And “support vectors” are what’s important because they are the data points that are closest to the opposing classes. Because these points are the only ones considered, all other training points can be ignored in the model. Essentially, you feed SVM training samples of trees and grass. Based on this training data, it builds the model generating a decision boundary of its own.
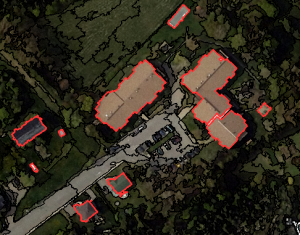
Now, the results of this supervised classification aren’t perfect and algorithms still have a lot more learning to do. We still need to work on features like roads, wetlands, and buildings. As algorithms get more training data, they will eventually improve to classify anywhere.
2. Image Segmentation and Clustering with K-means
By far, the K-means algorithm is one of the most popular methods of clustering data. In K-means segmentation, it groups unlabeled data into the number of groups represented by the variable K.
This unsupervised learning approach iteratively assigns each data point into one of the K groupings based on the similarity of features. For example, similarity can be based on spectral characteristics and location.
In unsupervised classification, the k-means algorithm first segments the image for further analysis. Next, each cluster is assigned a land cover class.
However, GIS can use clustering in other unique ways. For example, data points could represent crime and you may want to cluster hot and low spots of crime. Alternatively, you may want to segment based on socioeconomic, health, or environmental (like pollution) characteristics.
3. Prediction Using Empirical Bayesian Kriging (EBK)
As you may know, kriging interpolation predicts unknown values based on spatial pattern. It estimates weights based on the variogram. The quality of the estimated surface is reflected in the quality of the weights. More specifically, you want weights that give an unbiased prediction and the smallest variance.
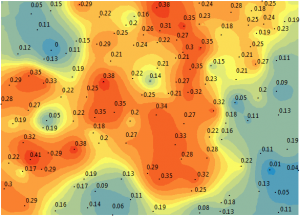
Unlike kriging which fits one whole model for an entire data set, EBK kriging simulates at least one hundred local models by sub-setting the whole data set. Because the model can morph itself locally to fit each individual semi-variogram using the kriging methodology, it overcomes the challenge of stationarity.
Empirical Bayesian Kriging (EBK) predicts over and over again using a variety of simulations up to a hundred times. Each semi-variogram varies from the other. In the end, it mixes all of the semi-variograms for a final surface. You can’t customize as you can with traditional kriging.
Finally, it outputs what it thinks is the best solution. Like a Monte Carlo analysis, it runs it repeatedly for you in the background. If it’s a random process, you let the random process run out over a thousand times. You see the trends in the resulting data and use that to justify your selection. This is why EBK almost always predicts better than straight kriging.
The Process of Deep Learning and Training for Big Data
Whether you’re in GIS or another field, machine learning is all the buzz these days. It’s about distilling big data sets. Because if you can let the computer detect the features, it will show you things you have never noticed.
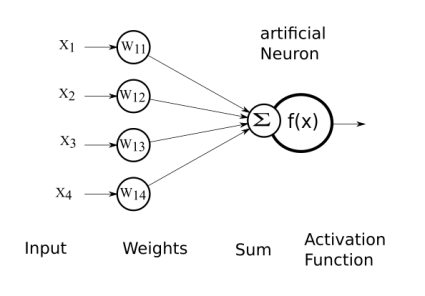
Because there’s too much data, you can uncover inherent patterns from it. The result is a trained neural network with just a set of weighted values.
When you train big data, this is when you’re going to need all the firepower you can get. But once you have the model trained, it’s just a model with a set of weights in a file… And this is why machine learning is a form of artificial intelligence – because you can train your data and then apply it to something entirely new and predict what it is.
Overall, GIS uses machine learning for prediction, classification, and clustering. AI and ML are still growing fields with a lot of frameworks still being developed daily.


One question: in the picture next to the explanation of the k-means algorithm, do I understand correctly that the k-value in this specific example is 2?
Thanks in advance and greetings.
I am looking to identify researchers or early stage companies focused on the application of unsupervised machine learning to very large geoscience data sets. Any suggestions
Learn Mat lab, and improve your coding skills in any computer language.
I would like to become an expert in machine learning, spatial analysis, and remote sensing.
I did an MSc in GIS.
Which courses do you recommend to me?