A Step-by-Step Guide to Creating Excel Maps

This step-by-step guide will walk you through the process of creating Excel maps from start to finish. You’ll get sample data, add it to Excel, and create an effective map.
With a few simple steps, you’ll be able to create a stunning choropleth map in Microsoft Excel. So let’s get started!
READ MORE: What is a Choropleth Map?
Preparing the Data
Before you can start, it’s important to prepare your data so that it’s optimized for mapping. There are a few things you will want to consider before importing the data.
First, you have to know that Excel can already recognize data if it exists as countries, states, counties, etc. As long as you have a column with a geography data type, you can plot it out in Excel. But keep in mind limitations may apply to what you can actually plot out in Excel.
In our example, we are using countries and GDP as two separate columns. You can scroll down to the bottom of this page to check out our sample data (click here to scroll down). If you want to follow along, simply highlight the table. Then, copy and paste it into Excel to import the data into your spreadsheet.
Creating a Choropleth Map
Now that you have the sample data in Excel, you can start creating your first map in Excel. First, you want to highlight both the country and GDP columns.
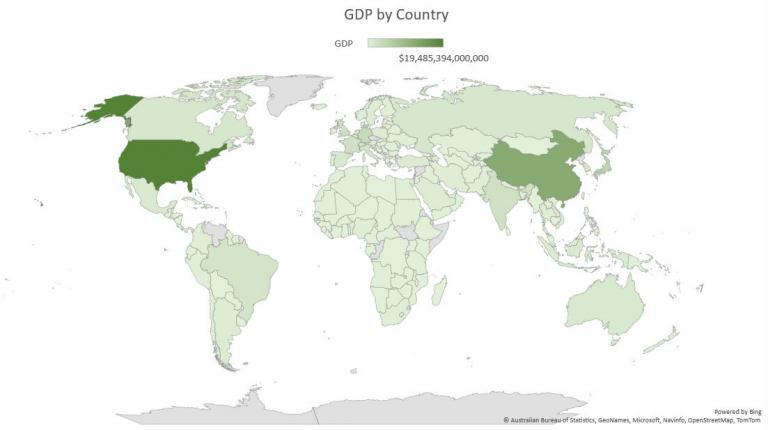
Once you’ve highlighted the data, select the “Insert” tab and click the “Filled map” button. This will create a choropleth map using the data that you’ve selected.
If you followed the steps correctly up to this point, the map should look similar to the choropleth map below.
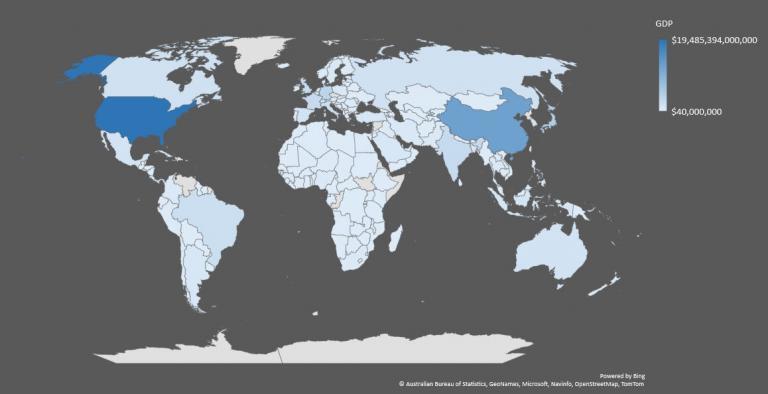
Customizing the Map
Now that you’ve created a choropleth map, it’s time to make it your own! There are a few things you can do to customize your map. All options are available in the “Chart Design” tab.
Summary: Excel Maps
Excel maps are a simple and effective way to visualize data for a geographic area. In this type of visual, the areas of a map are represented by different shades. Each shade represents a value, in our case, it’s GDP by country.
Making Excel maps is easier than you might think. With a few basic steps, you learned how to create a map in Excel that depicts GDP by country. The results are effective and provide a visual to the map reader.
If you’re looking for more information, check out Microsoft’s guide on how to create a map chart in Excel. This page also provides a sample worksheet that you can download with map chart examples.
Sample Data
Do you want to copy the map that we made in Excel? Use this sample data to build your very own choropleth map in Excel.
| Rank | Country | GDP |
| 1 | United States | $19,485,394,000,000 |
| 2 | China | $12,237,700,000,000 |
| 3 | Japan | $4,872,415,000,000 |
| 4 | Germany | $3,693,204,000,000 |
| 5 | India | $2,650,725,000,000 |
| 6 | United Kingdom | $2,637,866,000,000 |
| 7 | France | $2,582,501,000,000 |
| 8 | Brazil | $2,053,595,000,000 |
| 9 | Italy | $1,943,835,000,000 |
| 10 | Canada | $1,647,120,000,000 |
| 11 | Russia | $1,578,417,000,000 |
| 12 | South Korea | $1,530,751,000,000 |
| 13 | Australia | $1,323,421,000,000 |
| 14 | Spain | $1,314,314,000,000 |
| 15 | Mexico | $1,150,888,000,000 |
| 16 | Indonesia | $1,015,421,000,000 |
| 17 | Turkey | $851,549,000,000 |
| 18 | Netherlands | $830,573,000,000 |
| 19 | Saudi Arabia | $686,738,000,000 |
| 20 | Switzerland | $678,965,000,000 |
| 21 | Argentina | $637,430,000,000 |
| 22 | Sweden | $535,607,000,000 |
| 23 | Poland | $526,466,000,000 |
| 24 | Belgium | $494,764,000,000 |
| 25 | Thailand | $455,303,000,000 |
| 26 | Iran | $454,013,000,000 |
| 27 | Austria | $416,836,000,000 |
| 28 | Norway | $399,489,000,000 |
| 29 | United Arab Emirates | $382,575,000,000 |
| 30 | Nigeria | $375,745,000,000 |
| 31 | Israel | $353,268,000,000 |
| 32 | South Africa | $348,872,000,000 |
| 33 | Hong Kong | $341,449,000,000 |
| 34 | Ireland | $331,430,000,000 |
| 35 | Denmark | $329,866,000,000 |
| 36 | Singapore | $323,907,000,000 |
| 37 | Malaysia | $314,710,000,000 |
| 38 | Colombia | $314,458,000,000 |
| 39 | Philippines | $313,595,000,000 |
| 40 | Pakistan | $304,952,000,000 |
| 41 | Chile | $277,076,000,000 |
| 42 | Finland | $252,302,000,000 |
| 43 | Bangladesh | $249,724,000,000 |
| 44 | Egypt | $235,369,000,000 |
| 45 | Vietnam | $223,780,000,000 |
| 46 | Portugal | $219,308,000,000 |
| 47 | Czech Republic (Czechia) | $215,914,000,000 |
| 48 | Romania | $211,884,000,000 |
| 49 | Peru | $211,389,000,000 |
| 50 | New Zealand | $204,139,000,000 |
| 51 | Greece | $203,086,000,000 |
| 52 | Iraq | $192,061,000,000 |
| 53 | Algeria | $167,555,000,000 |
| 54 | Qatar | $166,929,000,000 |
| 55 | Kazakhstan | $162,887,000,000 |
| 56 | Hungary | $139,761,000,000 |
| 57 | Angola | $122,124,000,000 |
| 58 | Kuwait | $120,126,000,000 |
| 59 | Sudan | $117,488,000,000 |
| 60 | Ukraine | $112,154,000,000 |
| 61 | Morocco | $109,709,000,000 |
| 62 | Ecuador | $104,296,000,000 |
| 63 | Cuba | $96,851,000,000 |
| 64 | Slovakia | $95,618,000,000 |
| 65 | Sri Lanka | $87,357,000,000 |
| 66 | Ethiopia | $80,561,000,000 |
| 67 | Kenya | $79,263,000,000 |
| 68 | Dominican Republic | $75,932,000,000 |
| 69 | Guatemala | $75,620,000,000 |
| 70 | Oman | $70,784,000,000 |
| 71 | Myanmar | $67,069,000,000 |
| 72 | Luxembourg | $62,316,000,000 |
| 73 | Panama | $62,284,000,000 |
| 74 | Ghana | $58,997,000,000 |
| 75 | Bulgaria | $58,221,000,000 |
| 76 | Costa Rica | $57,286,000,000 |
| 77 | Uruguay | $56,157,000,000 |
| 78 | Croatia | $55,213,000,000 |
| 79 | Belarus | $54,456,000,000 |
| 80 | Lebanon | $53,577,000,000 |
| 81 | Tanzania | $53,321,000,000 |
| 82 | Macao | $50,361,000,000 |
| 83 | Uzbekistan | $49,677,000,000 |
| 84 | Slovenia | $48,770,000,000 |
| 85 | Lithuania | $47,544,000,000 |
| 86 | Serbia | $41,432,000,000 |
| 87 | Azerbaijan | $40,748,000,000 |
| 88 | Jordan | $40,068,000,000 |
| 89 | Tunisia | $39,952,000,000 |
| 90 | Paraguay | $39,667,000,000 |
| 91 | Libya | $38,108,000,000 |
| 92 | Turkmenistan | $37,926,000,000 |
| 93 | DR Congo | $37,642,000,000 |
| 94 | Bolivia | $37,509,000,000 |
| 95 | Côte d’Ivoire | $37,353,000,000 |
| 96 | Bahrain | $35,433,000,000 |
| 97 | Cameroon | $34,923,000,000 |
| 98 | Yemen | $31,268,000,000 |
| 99 | Latvia | $30,463,000,000 |
| 100 | Estonia | $26,612,000,000 |
| 101 | Uganda | $25,995,000,000 |
| 102 | Zambia | $25,868,000,000 |
| 103 | Nepal | $24,880,000,000 |
| 104 | El Salvador | $24,805,000,000 |
| 105 | Iceland | $24,488,000,000 |
| 106 | Honduras | $22,979,000,000 |
| 107 | Cambodia | $22,158,000,000 |
| 108 | Trinidad and Tobago | $22,079,000,000 |
| 109 | Cyprus | $22,054,000,000 |
| 110 | Zimbabwe | $22,041,000,000 |
| 111 | Senegal | $21,070,000,000 |
| 112 | Papua New Guinea | $20,536,000,000 |
| 113 | Afghanistan | $19,544,000,000 |
| 114 | Bosnia and Herzegovina | $18,055,000,000 |
| 115 | Botswana | $17,407,000,000 |
| 116 | Laos | $16,853,000,000 |
| 117 | Mali | $15,334,000,000 |
| 118 | Georgia | $15,081,000,000 |
| 119 | Gabon | $15,014,000,000 |
| 120 | Jamaica | $14,781,000,000 |
| 121 | State of Palestine | $14,498,000,000 |
| 122 | Nicaragua | $13,814,000,000 |
| 123 | Mauritius | $13,266,000,000 |
| 124 | Namibia | $13,254,000,000 |
| 125 | Albania | $13,039,000,000 |
| 126 | Mozambique | $12,646,000,000 |
| 127 | Malta | $12,518,000,000 |
| 128 | Burkina Faso | $12,323,000,000 |
| 129 | Equatorial Guinea | $12,294,000,000 |
| 130 | Bahamas | $12,162,000,000 |
| 131 | Brunei | $12,128,000,000 |
| 132 | Armenia | $11,537,000,000 |
| 133 | Madagascar | $11,500,000,000 |
| 134 | Mongolia | $11,434,000,000 |
| 135 | North Macedonia | $11,280,000,000 |
| 136 | Guinea | $10,473,000,000 |
| 137 | Chad | $9,871,000,000 |
| 138 | Benin | $9,247,000,000 |
| 139 | Rwanda | $9,135,000,000 |
| 140 | Congo | $8,701,000,000 |
| 141 | Haiti | $8,408,000,000 |
| 142 | Moldova | $8,128,000,000 |
| 143 | Niger | $8,120,000,000 |
| 144 | Kyrgyzstan | $7,565,000,000 |
| 145 | Tajikistan | $7,146,000,000 |
| 146 | Malawi | $6,303,000,000 |
| 147 | Guam | $5,859,000,000 |
| 148 | Fiji | $5,061,000,000 |
| 149 | Mauritania | $5,025,000,000 |
| 150 | Maldives | $4,866,000,000 |
| 151 | Montenegro | $4,845,000,000 |
| 152 | Togo | $4,758,000,000 |
| 153 | Barbados | $4,674,000,000 |
| 154 | Eswatini | $4,434,000,000 |
| 155 | Sierra Leone | $3,775,000,000 |
| 156 | Guyana | $3,621,000,000 |
| 157 | Liberia | $3,285,000,000 |
| 158 | Burundi | $3,172,000,000 |
| 159 | Andorra | $3,013,000,000 |
| 160 | Suriname | $2,996,000,000 |
| 161 | Timor-Leste | $2,955,000,000 |
| 162 | Aruba | $2,701,000,000 |
| 163 | Lesotho | $2,578,000,000 |
| 164 | Bhutan | $2,528,000,000 |
| 165 | Central African Republic | $1,949,000,000 |
| 166 | Belize | $1,863,000,000 |
| 167 | Cabo Verde | $1,773,000,000 |
| 168 | Saint Lucia | $1,738,000,000 |
| 169 | San Marino | $1,633,000,000 |
| 170 | Northern Mariana Islands | $1,593,000,000 |
| 171 | Antigua and Barbuda | $1,510,000,000 |
| 172 | Seychelles | $1,498,000,000 |
| 173 | Gambia | $1,489,000,000 |
| 174 | Guinea-Bissau | $1,347,000,000 |
| 175 | Solomon Islands | $1,303,000,000 |
| 176 | Grenada | $1,127,000,000 |
| 177 | Comoros | $1,068,000,000 |
| 178 | Saint Kitts & Nevis | $992,000,000 |
| 179 | Vanuatu | $863,000,000 |
| 180 | Samoa | $841,000,000 |
| 181 | St. Vincent & Grenadines | $785,000,000 |
| 182 | American Samoa | $634,000,000 |
| 183 | Dominica | $497,000,000 |
| 184 | Tonga | $428,000,000 |
| 185 | Sao Tome & Principe | $393,000,000 |
| 186 | Micronesia | $336,000,000 |
| 187 | Palau | $290,000,000 |
| 188 | Marshall Islands | $204,000,000 |
| 189 | Kiribati | $186,000,000 |
| 190 | Tuvalu | $40,000,000 |