ArcGIS ModelBuilder: How to Create a Custom Toolbox
What is ModelBuilder in ArcGIS Desktop and ArcGIS Pro?
ModelBuilder in ArcGIS automates your GIS workflows. For example, if you run a report every week that you run a buffer, intersect, and generate a pivot table… then you can create a single model and run it every week.
Instead of running each tool one by one, you create a model that takes your input, transforms it with a series of tools, and then outputs it. In other words, ModelBuilder connects your input to geoprocessing tools and transforms it into your desired output.
The best part?
When you create a model in ModelBuilder, you can run it as part of your daily workflow. For example, you can reuse models and share them with other users to interact.
Follow along step-by-step below with your own data and tools. Of course, if you have any questions, don’t be afraid to ask in the comment box below.
How To Set Up Your First Model
Let’s start with this simple example of how to create a model in ModelBuilder. Pretend you work for a company that plans out where pipelines will be built. To comply with environmental regulations, the pipeline can’t be 500 meters away from endangered bird nests.
As engineers modify the design of the pipeline often, they would like a spreadsheet every time they change the alignment of the pipeline. In this report, they want to know if the pipeline is within 500 meters of any bird nests.
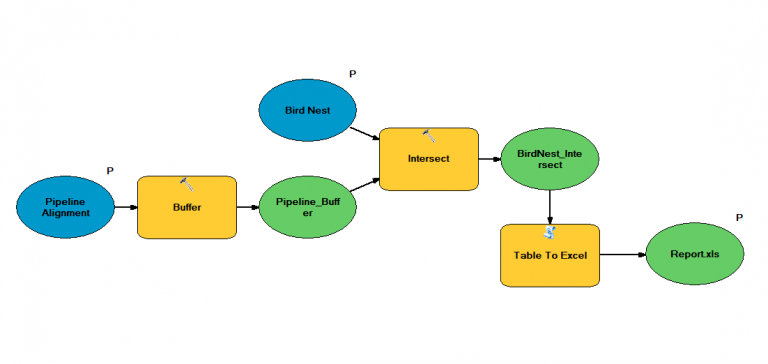
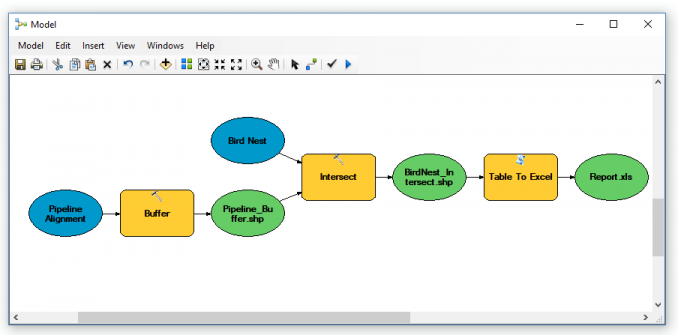
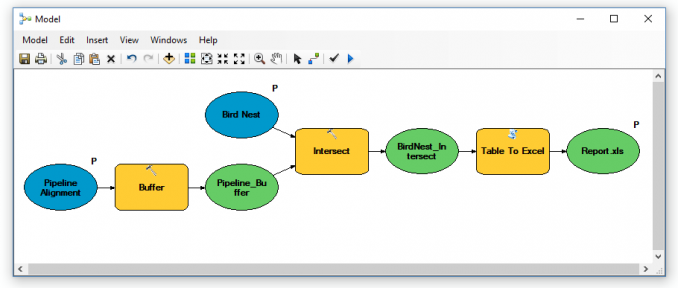
A model usually consists of at least three elements:
- Input Data (blue squares)
- Geoprocessing Tools (yellow circles)
- Output Data (green squares)
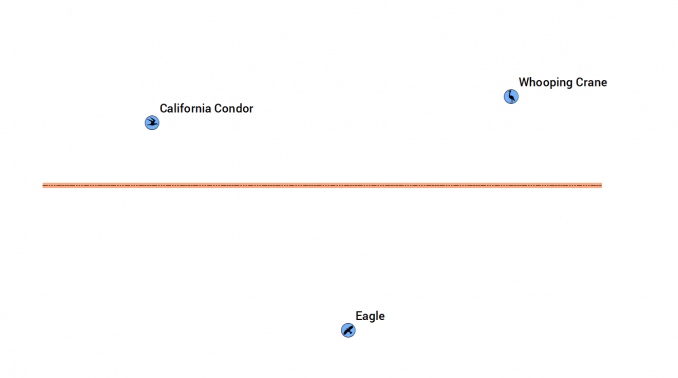
In our ModelBuilder example, here are the two inputs:
Input 1. Pipeline alignment (red and black-dashed line)
Input 2. Endangered bird nests
And here’s what these inputs look like on a map:
Tool 1. Buffer pipeline 500 meters
Tool 2. Intersect bird nests with pipeline buffer
Tool 3. Generate a report as a spreadsheet
Output 1. Buffer, Bird Nests in Buffer, Report
Let’s start with this simple step-by-step example of how to build a model in ModelBuilder.
Step 1. Open ModelBuilder
First, click the ModelBuilder icon to start creating a model. This will open the ModelBuilder window for you to start adding your geoprocessing tools.
Step 2. Add tools in ModelBuilder
Drag and drop the buffer, Intersect tool, and Excel spreadsheet conversion tools from ArcToolbox.
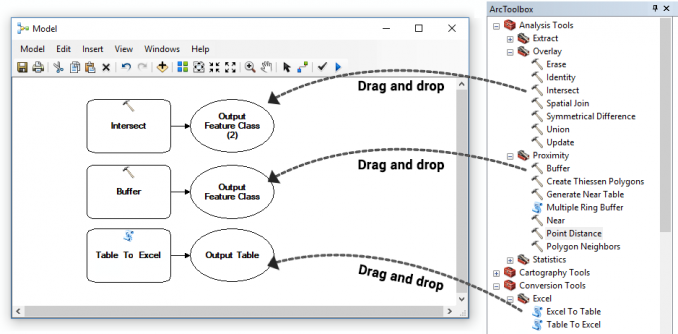
All you have to do is open the panel for ArcToolbox. Next, simply just drag and drop any tool you want to use in the interface.
Step 3. Enter tool parameters
Double-click each tool (rectangle) and enter the following inputs and outputs:
BUFFER:
Input Features: Pipeline Realignment
Output Feature Class: C:\Temp\Pipeline_Buffer.shp (Make sure this directory exists or create a new folder if necessary)
Linear Distance: 500 meters
INTERSECT:
Input Features: Bird Nest and Pipeline_Buffer.shp
Output Feature Class: C:\Temp\BirdNest_Intersect.shp
TABLE TO EXCEL:
Input Table: BirdNest_Intersect.shp
Output Excel File: C:\Temp\Report.xls
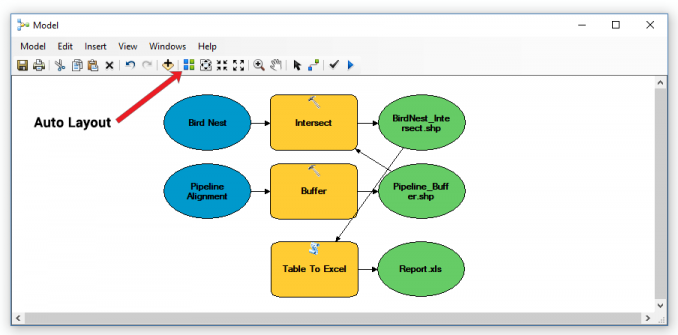
After entering the inputs and outputs for each tool, the ModelBuilder window will look like the screenshot above. However, it looks disorganized and the auto-layout tool can help clean everything up.
Step 4. Auto Layout
After you click the auto-layout button, the geoprocessing tools, inputs, and outputs will rearrange themselves neatly in the ModelBuilder window.
Even if you don’t like how it organizes the tool after pushing the “Auto Layout” button, you can then further customize the layout by dragging any of the inputs, tools, or outputs.
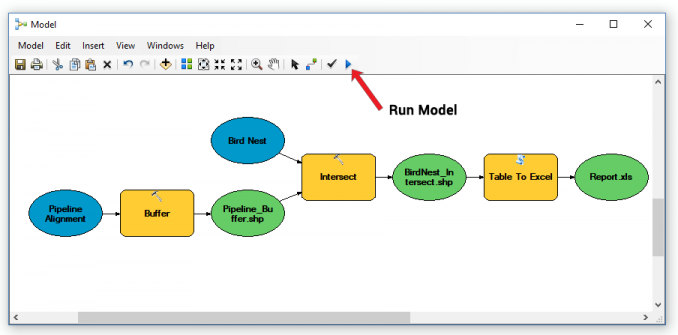
ModelBuilder Example: Running the Model
Of course, we have only built the model up to this point. To create the report, we still have to run the model. You can run the model by clicking the “Play” button.
After you run your model, you can add your output feature classes to ArcMap to verify it is correct. By double-clicking the report.xls, it lists all bird nests within 500 meters of the pipeline. In this case, it’s only the California Condor.

Another thing to note is that after you run your model, circles, and squares in the model will have shadows. Check (C:\Temp\) to see each product it creates (buffer, intersect, and report).
But really, the only output you need is just the report. The buffer and intersect are just temporary (intermediate) data sets. After running a model from the ModelBuilder window, it doesn’t delete all the intermediate outputs (buffer and intersect) that it creates.
So if you want to re-run the model, you can manually go into this folder (“C:\Temp\”) and delete these feature classes. Also, you may have to click the “checkmark” icon next to the “auto-layout” icon to validate the model.
ModelBuilder Toolbox: Setting up Parameters/Variables
Let’s say another group in your company wants to use this model for the same purpose. But their input data and output data have completely different names.
Instead of static input and output, you need them to be dynamic as parameters. When you set the input data or output data as parameters, users can enter their own data and set their own output paths.
How do you set up ModelBuilder parameters?

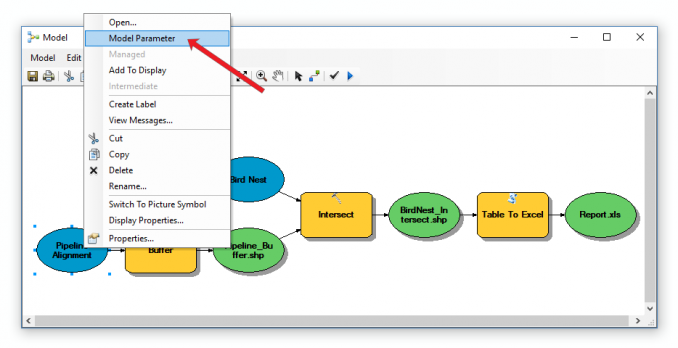
Step 1. Set model parameters for inputs
Right-click your two input data sets (bird nests and pipeline) and click ‘Model Parameter’. This will set your input as a model parameter.
Step 2. Set model parameter for output
Right-click your output data set (report) and click ‘Model Parameter’.
But there’s one more thing that we’ll have to change – how it handles intermediate data. ArcGIS ModelBuilder has a handy command called ‘in_memory’ to handle it.
For each temporary output (buffer and intersect), we can turn these into temporary datasets with ‘in_memory’. For example, double-click the green box (pipeline_buffer) and change it as follows:
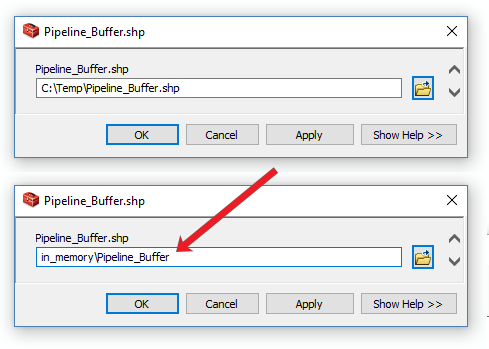
After this step, your model should have “P” next to each model parameter. Also, your temporary buffer and intersect output should have ‘in_memory’ for the output.
Delete all the files in (C:\Temp\). Now, when you click “Run Model”, it will only create the XLS report. And this is because you set the buffer and process it as temporary data (in_memory).
How to Create a Toolbox in ArcGIS
Now that we’ve set the input and output as parameters, wouldn’t it be nice if this could be a toolbox on its own? First, toolboxes are convenient to share. Secondly, they look professional. And finally, they are easy to create.
First, let’s empty the parameters so that when we share them, there isn’t a default path. Double-click each model parameter in ModelBuilder and empty it.
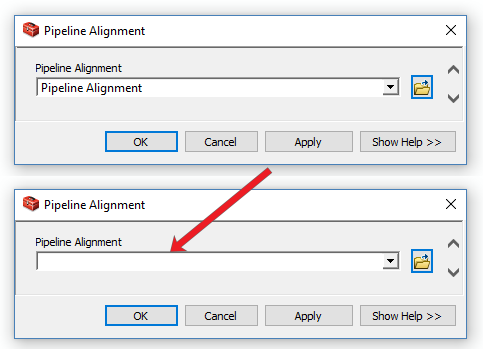
Once you’ve emptied each parameter, the model should look white like in the screenshot below:
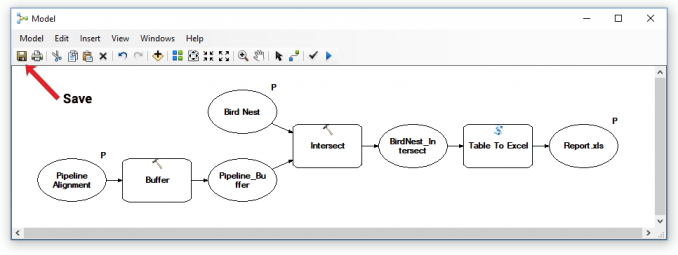
Now, you’ll want to save your model. But you’re going to need a toolbox to do so. After clicking “Save”, click the new toolbox icon in the top-right of the dialog box.
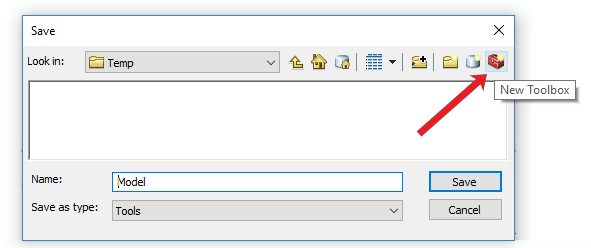
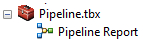
You can name the new toolbox “Pipeline.tbx”. Now, double-click this new toolbox and save the model within the toolbox.
In ArcCatalog, locate where you just saved this toolbox. Expand the toolbox so you can see your new toolset.
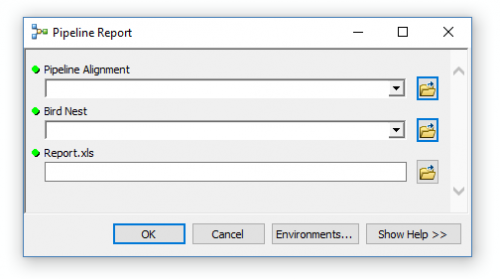
Double-click the new toolset that you have created. Now, that we have created parameters and emptied them, you can dynamically enter your inputs and outputs.
How To Export a Model as a Python Script
Since ArcGIS 9.0, it has completely overhauled its programming interface from VBA to Python. By using Python libraries, you can extend ArcGIS. But now that Python has been proven to be a great tool, where do you begin? Sure, you can start with python.org but this is a lot of information for you to start with.
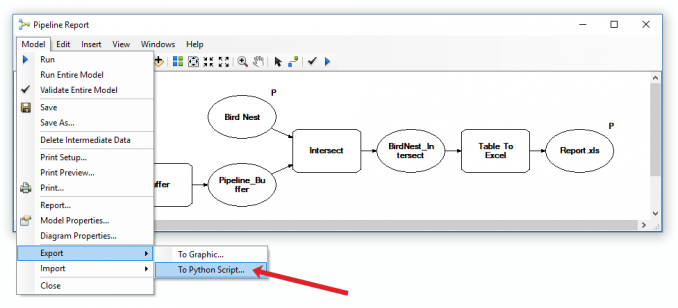
Another way to save you time is to use ModelBuilder and create a model for your workflow. Once you get the model working, then export the model as a script (Model > Export > To Python Script). The output of this export provides a great starting point where you can alter the Python code and even include other Python packages.
This is probably one of the best ways for you to begin learning Python scripting in ArcGIS. You can see how ModelBuilder breaks up the code with Arcpy modules, script arguments, local variables, and geoprocessing tools.
ModelBuilder Iterators
Iterators help repeat a process for a set of inputs in ModelBuilder. ArcGIS ModelBuilder has different types of iterators to repeat processes.
For example, if you want to set multiple distances for buffers at different increments, you can use the ‘FOR’ iterator. Using the buffer tool from our existing model, you can set “FROM” and “TO” variables at different increments.
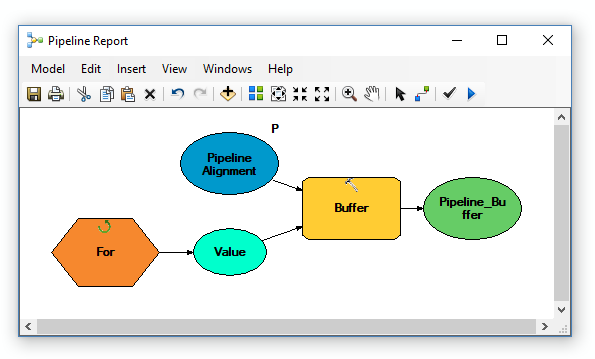
In the ModelBuilder window above, we added an iterator to the model. This will dynamically set the buffer distance as described in the ‘FOR’ iterator.
Other iterators available are: “while”, “row selection”, “feature selection”, “multivalue” and more.
ModelBuilder in ArcGIS Desktop
Because at your job, time is of the essence. You need to provide answers to real-life GIS problems at break-neck speeds.
ModelBuilder in ArcGIS automates your GIS workflows. When you create a model, you can repeatedly perform your analysis.
Instead of manually running each tool one at a time, try putting them in a model next time.
ModelBuilder is a robust way to analyze your GIS data and is a huge time saver.
READ MORE: GIS Programming Tutorials: Learn How to Code


I can’t express, how much you guys made GIS easy.
It should be very nice if you embeded the dataset used to provide the workflow for the beginners who would want to learn in depth and better understand this tutorial on geoprocessing.
If we want to regrid the spatial data of resolution 1.0 degree to 0.5 degrees, how can we do this using model builder in ArcGIS 10.2
Please can you show me the module for mosaic raster files with raster iterator..
In ArcGis Pro ESRI dropped the “export to Python” functionality. So if you want to use the model builder as a starting point for a script, you’ll have to use ArcGis desktop.
https://community.esri.com/thread/163291
Can I bring in custom applications? If I can what format do they need to be in?
What about parts of the procedure that are done in Excel?
It was useful. Please add some contents to explain how to share these custom toolboxes with other users.
Thank you! very brief but smart and useful explanation!
Is something like this in QGIS?
Thx
Yes, it’s called “Graphical Modeler”.