St. Paul Crime Map
This St. Paul crime map is your resource for understanding the safety landscape of this city and to help visualize crime across neighborhoods
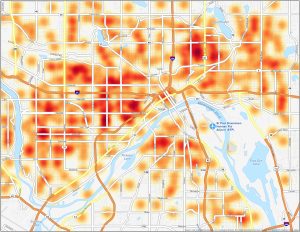
This St. Paul crime map is your resource for understanding the safety landscape of this city and to help visualize crime across neighborhoods
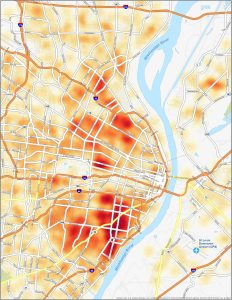
Visualize the safety landscape with this St. Louis Crime Map. Using a heat map style visual can help you identify clusters of crime.
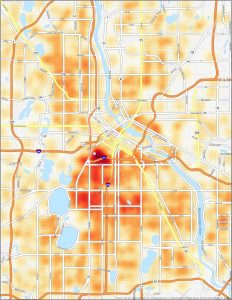
While exploring the city of Minneapolis, safety is undoubtedly a top priority. That’s why we present to you this Minneapolis crime map.
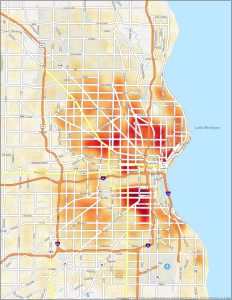
This crime map of Milwaukee offers a data-driven approach, helping everyone learn about crime patterns in Brew City.
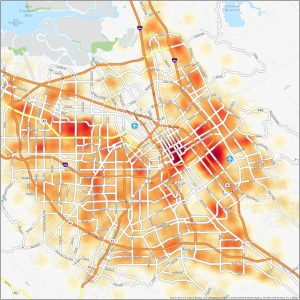
Download our San Jose crime map. This is your go-to resource for exploring the safety of San Jose, California in a heat map style visual.
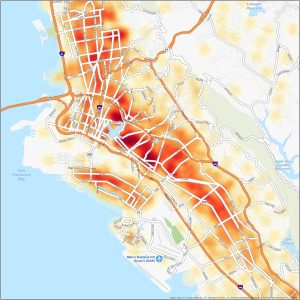
Our Oakland crime map is your key to understanding the safety landscape of this city in California. Be more aware of crime with this heat map.
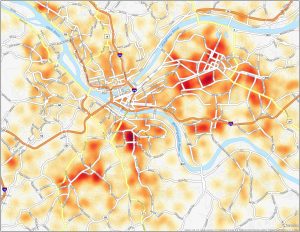
Whether you’re a potential homebuyer or just curious about crime statistics, this Pittsburgh crime map explores the city’s crime data.
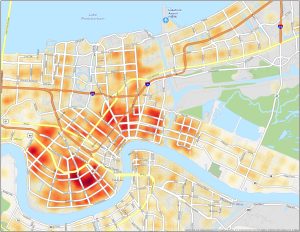
While New Orleans is known for its festive atmosphere, this New Orleans crime map will be your way to understanding the safety landscape.
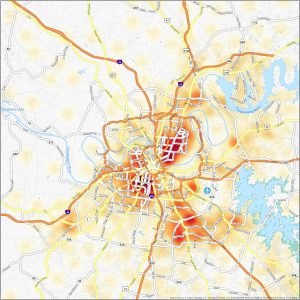
Enhance your awareness while exploring the Music City. This Nashville crime map showcases neighborhoods in a crime heat map type of visual.
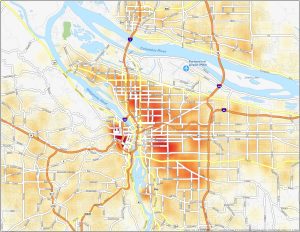
This Portland crime map provides an overview of reported incidents, helping anyone make informed decisions while navigating the city.