Time Series Animation in ArcGIS

A time-series animation in ArcGIS integrates time with spatial data. Time series animations work wonders… especially when visualizing events.
Imagine watching the melting of polar ice caps or the spread of a forest fire or disease over time.
Showing these types of events captures your audience by viewing geography change with time.
These tools are at your fingertips. Follow this ArcGIS time series animation in this guide to learn more.
Step 1. Add Date Field in Attribute Data & Enable Time

No surprises here. We need a shapefile that has a date field in the attribute data. (It cannot be a text field).
But this isn’t the only requirement. You have to enable time in your layer.
Right-click your time feature. Click properties. In the “Time” tab, select “Enable time in this layer”. Now, your feature is time-aware.
Set up the time step interval. Are you working with hourly, daily, or yearly data? Select the best option and click calculate.
Additionally, you can configure start and end times, field formats, and time zone adjustments.
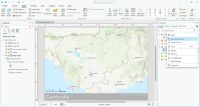
Step 2. Time Slider Window

The time slider is the clock icon in the “Tools” toolbar. It can only be selected if you have a time-enabled data set in your map.
The time slider gives you the option to visualize your time animation in the display for a specific point in time.
The current time shown in the time slider is what will be shown on the map. This can include changes in the symbology if these values change.
From here you can export an AVI video with the film button. You can set more options with the time series animation toolbar (see below).
Step 3. Create a Time Series Animation

The “Animation” toolbar (Customize> Toolbars>Animation) is used to create and save time series animations in ArcMap.
This toolbar gives you the capability to create animations (Animation>Create Time Animation) and export them (Animation>Export Animation).
The animation controls allow you to customize the number of seconds or minutes the animation will run.
Summary: Time Series in GIS
Time Series Animation in ArcGIS Steps
1. Enable time in your layer.
2. Visualize your animation with the time slider.
3. Export the AVI file.
…..And cut!


