What is NDVI (Normalized Difference Vegetation Index)?
What is NDVI (Normalized Difference Vegetation Index)?
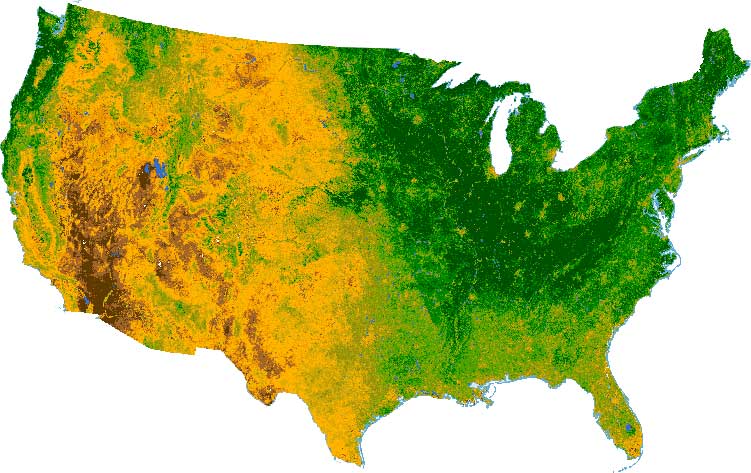
NDVI always ranges from -1 to +1. But there isn’t a distinct boundary for each type of land cover.
For example, when you have negative values, it’s highly likely that it’s water. On the other hand, if you have an NDVI value close to +1, there’s a high possibility that it’s dense green leaves.
But when NDVI is close to zero, there are likely no green leaves and it could even be an urbanized area.
NDVI is the most common index that analysts use in remote sensing. But how do you calculate it? What do NDVI values represent? How do Earth scientists use NDVI?
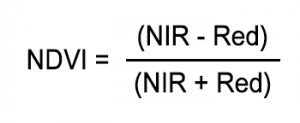
“Normalized Difference Vegetation Index (NDVI) quantifies vegetation by measuring the difference between near-infrared (which vegetation strongly reflects) and red light (which vegetation absorbs).”
How do you calculate NDVI?
As shown below, Normalized Difference Vegetation Index (NDVI) uses the NIR and red channels in its formula.
Healthy vegetation (chlorophyll) reflects more near-infrared (NIR) and green light compared to other wavelengths. But it absorbs more red and blue light.
This is why our eyes see vegetation as the color green. If you could see near-infrared, then it would be strong for vegetation too. Satellite sensors like Landsat and Sentinel-2 both have the necessary bands with NIR and red.
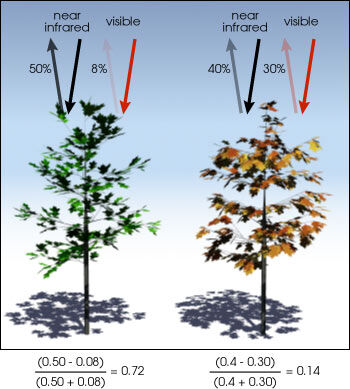
The result of this formula generates a value between -1 and +1. If you have low reflectance (or low values) in the red channel and high reflectance in the NIR channel, this will yield a high NDVI value. And vice versa.
Overall, NDVI is a standardized way to measure healthy vegetation. When you have high NDVI values, you have healthier vegetation.
When you have low NDVI, you have less or no vegetation. Generally, if you want to see vegetation change over time, then you will have to perform an atmospheric correction.
Example of NDVI in agriculture
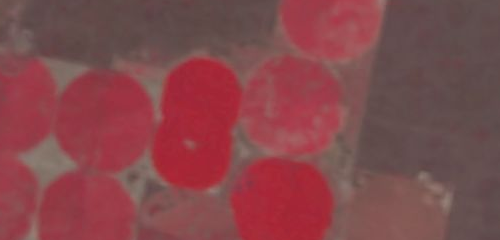
Let’s examine NDVI for an agricultural area with center pivot irrigation. Pivot irrigation rotates on a point creating a circular crop pattern.
In true color, here’s how it looks for red, green, and blue bands. We say true color because it is the same as how our eyes see.
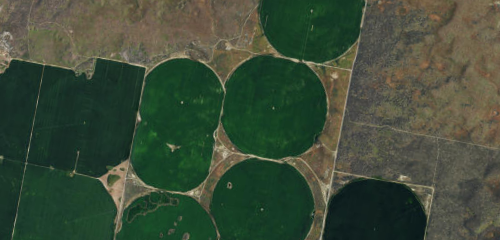
In the formula, you can see how NDVI leverages near-infrared (NIR). So when we put the NIR band to display as red, we get color infrared. We say color infrared because near-infrared is in the red channel. As you can see below, the pivot irrigation vegetation should already be shouting out at you in bright red!
When you apply the formula, bright green indicates high NDVI. Whereas red has low NDVI. So it’s quantifying vegetation by measuring the difference between near-infrared (which vegetation strongly reflects) and red light (which vegetation absorbs).
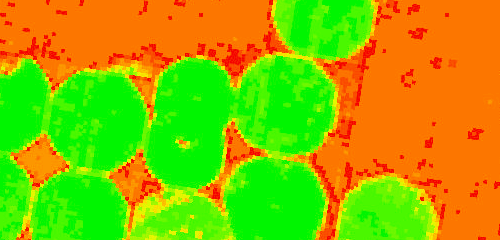
As you can see, it’s easy to pick out the pivot irrigation circles using NDVI. It makes it easier to classify because of NDVI.
How do we use NDVI?
We see several sectors using NDVI. For example, in agriculture, farmers use NDVI for precision farming and to measure biomass.
Whereas, in forestry, foresters use NDVI to quantify forest supply and leaf area index.
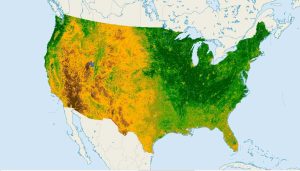
Furthermore, NASA states that NDVI is a good indicator of drought. When water limits vegetation growth, it has a lower relative NDVI and density of vegetation.
In reality, there are hundreds of applications where NDVI and other remote sensing applications are being applied in the real world.
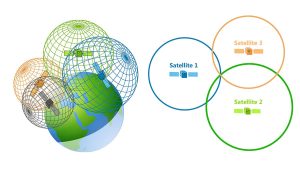
Which satellite imagery has near-infrared for NDVI?
As mentioned before, satellites like Sentinel-2, Landsat, and SPOT produce red and near-infrared images.
This list of 15 free satellite imagery data sources has data that you can download and create NDVI maps in ArcGIS or QGIS.
For example, we use NDVI in agriculture, forestry, and the environment.
Do you know any applications using NDVI?

Can we map drought areas using NVVI?
Data from LANDSAT masks water bodies to calculate NDVI. But why not include values from the adjacent water bodies to calculate the average vegetation around us? Thanks.
What is the limitation of NDVI to other vegetation indices ?
It’s good for detecting vegetation. But it might not be so good at determining something like soil moisture content, which could be better with synthetic aperture radar. There are a lot of different examples you can come up with.
Can I detect the impact of LULC change on river water quality using NDVI? in the case of one river catchment….
Is it possible to create a DTM from NDVI for a dense canopy forest area? Thinking if I can combine the NDVI with the CHM to produce a somewhat reliable DTM. I’m looking for DTM for exploration purposes.
Hi Alvin. I personally don’t think it is possible. Would the criteria be a higher NDVI is equal to higher elevation? That’s the equivalent of saying more green means more height. There may be a tiny correlation between the two, but I have my doubts for a strong relationship or any at all.
Very useful information for NDVI.
What is the level of difference in the use of corrected data and the data that has not been corrected?
To see real change over time, the inverse z score of NDVI is necessary, and that is called the Fuel Moisture Stress Index (FMSI, Yool, 2009). This takes into account observed NDVI values across a mean observation. The longer the timespan of observed values, the more accurate model of vegetation robustness will be produced.
Hi, Google Earth Engine is also a very powerful tool for analysing NDVI temporally and spatially.
Can anybody tell me the use of NDVI in lanslide susceptibility mapping??
Could it be that the removal of vegetation makes areas more susceptible to landslides? So low NDVI = less vegetation = more susceptibility to landslides
Because the atmospheric conditions vary a lot from day to day and that can mask/ show changes on vegetation that are not really there.
If you’re comparing NDVI from different periods of time, you should perform atmosphere corrections – https://gisgeography.com/atmospheric-correction/
Can anyone please tell me the reason of saying this; “Generally, if you want to see vegetation change over time, then you will have to perform atmospheric correction”. I mean why is it that one needs atmospherically corrected data only in the case when he is going for vegetation change over time.
I want to ask another thing. Is the formula of NDVI, that is specified here, is same/valid for both level-1 (not atmospherically corrected) and level- (atmospherically corrected) data?