ArcGIS Arcade: A Quick Guide for Beginners
The world Is your playground
ArcGIS Arcade is a simple and lightweight expression language that you can use in the entire ArcGIS platform.
That’s right. This means that it’s not just for ArcGIS Online (AGOL). Instead, you can use it in ArcGIS Pro, the JavaScript API, and even Collector.
Here, we’ll introduce you to ArcGIS Arcade and give you an overview of why you would use it in the ArcGIS platform.
We’ll also outline how it can help you in your work with some concrete examples and use cases. Let’s get started.
Why even use ArcGIS Arcade?
The first question you’re probably asking is – “why even use ArcGIS Arcade?” when Python is available. Because Python is one of those GIS programming languages that has seen tremendous growth, can’t you do it in Python instead?
First, Arcade will never replace Python because you can’t write long scripts with it. Instead, it’s more of an expression builder like in Excel. First, you set up a function or logic statement. Then, it outputs a value based on the expression.
But the reason why ArcGIS Arcade exists is because of its convenience. For instance, you can calculate values “on the fly” in a web map, query features, change the symbology or labels, and even customize pop-up windows with ArcGIS Arcade.
ArcGIS Arcade Use Cases and Examples
There are various ways you can use ArcGIS Arcade in the ArcGIS platform. Its main advantage is that it can return values similar to Excel so you don’t have to create new fields in your data.
But there are other uses as well. Here are three examples of how to use Arcade as an expression builder.
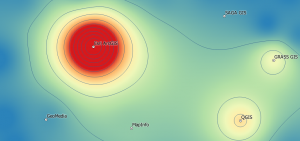
1. Changing Symbology
Let’s say you want to normalize a value. Because of the Arcade expression builder, you don’t have to create a brand new field in the raw data. Instead, you can create a new expression and use this to dynamically display data.
First, you have to use the Arcade expression builder. Then, you pick the two fields to add together, and you can divide by another field to normalize your data. Finally, you can give the expression a name and use it to drive your symbology in your web map.
($feature.VALUE1 + $feature.VALUE2) / $feature.POPULATION
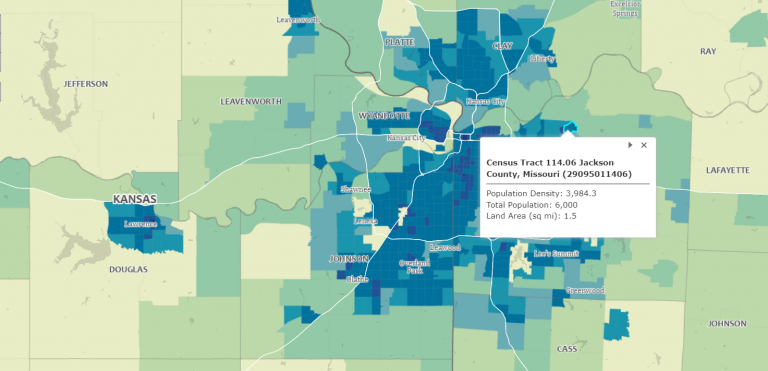
Expression = NormalizedValue2. Creating Labels
Similarly, if you want to display a customized label on a map, you don’t have to create a brand new field in the data and use the field calculator. Instead, you can create a new Arcade expression and reuse any previous Arcade expressions you have already created.
For instance, you can format any value by rounding the decimal places. Finally, you can display the customized label from this new Arcade expression.
Round(($feature.VALUE1 + $feature.VALUE2) / $feature.POPULATION), 2)
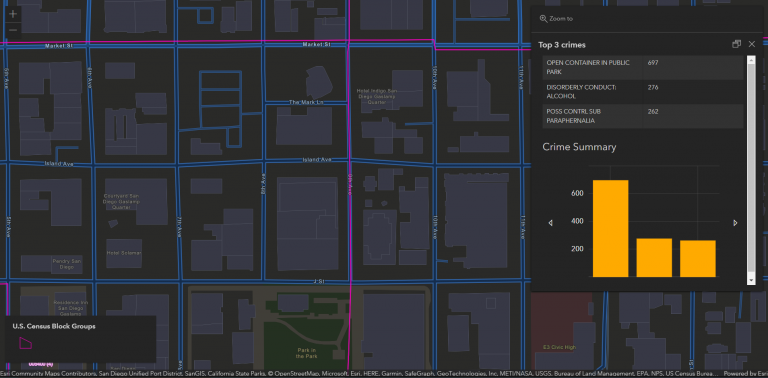
Expression = RoundedValue3. Customizing Pop-up Windows
By using Arcade, you can also configure pop-up windows with any expressions you build. For example, you can even add charts, change the colors of the bars in a graph, and even sort values on a chart. Plus, any expressions you build can be displayed on the fly in a pop-up window on your map.
The convenience of ArcGIS Arcade
When it all comes down to it, ArcGIS Arcade is all about convenience for building expressions.
Before ArcGIS Arcade existed, you would have had to create a new field and then populate the field with values.
But because you can use ArcGIS Arcade, now you can do it “on the fly” within the web map itself without creating any new fields in the raw data.
Arcade is not only convenient for symbology, but you can use it for customizing ArcGIS Pro labels and pop-up windows as well.
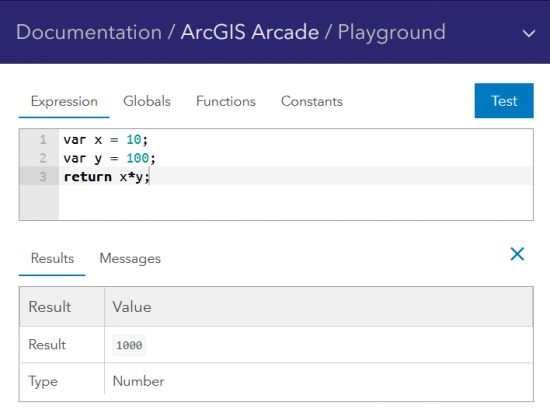
Reference
- ArcGIS Arcade Playground – For writing and testing out Arcade expressions
- Function Reference – The official reference for functions in Arcade
- Arcade Expressions (Github) – A Github repository of useful Arcade expressions that you can plug and play