What is Geostatistics?
DEFINITION:
Geostatistics is a branch of statistics that deals with analyzing and predicting spatial data and any type location-based data.
What is the Importance of Geostatistics?
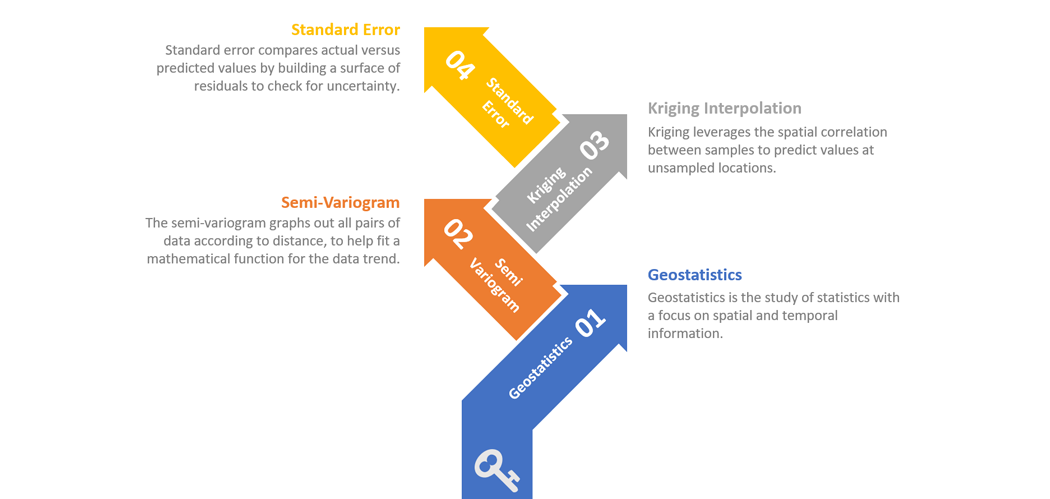
Geostatistics is the study of statistics with a focus on spatial and temporal information. The aim is to model and find patterns of geographic phenomena.
The field of geostatistics covers a wide range of spatial statistical topics such as:
- Semi-variograms to characterize the spatial pattern in the data
- Kriging for spatial prediction
- Standard error to measure uncertainty about unsampled values
Geostatistics is a growing field of study that we use in mining, climate studies, soil science, and most environmental fields.
Why use geostatistics?
The three main tools that geostatistics provides are:
- Semi-variograms to model the relationship between all pairs of points.
- Kriging modeling to predict values at unsampled locations.
- Standard error to measure confidence at unsampled values.
For example, if you have soil samples at specific locations, geostatistics can answer these types of questions:
- What is the forecasted amount of soil moisture at unsampled locations?
- How confident is the spatial prediction for the amount of soil moisture true?
This is different from deterministic interpolation techniques like Inverse Distance Weighting (IDW), where it just estimates unknown locations.
In general, IDW uses a predefined power function. Then, the result is what it is. But it doesn’t tell you how confident you are.
READ MORE: Kriging Interpolation – The Prediction Is Strong in this One
Geostatistics Tools and Topics
Semi-variograms
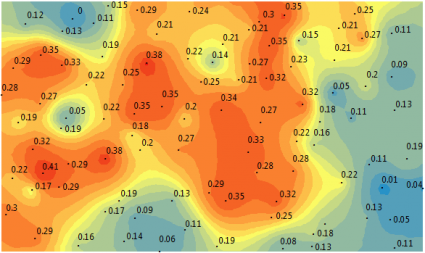
Geostatistics provides descriptive tools like semivariograms to identify underlying trends in spatial phenomena. According to Tobler’s First Law of Geography, closer things are more related than things farther away. This is also the main idea for the concept of spatial autocorrelation.
The semivariogram graphs out all pairs of data according to distance. Observations closer together have a higher correlation. But at a certain distance (range), there is no longer a relationship between points that are close together.
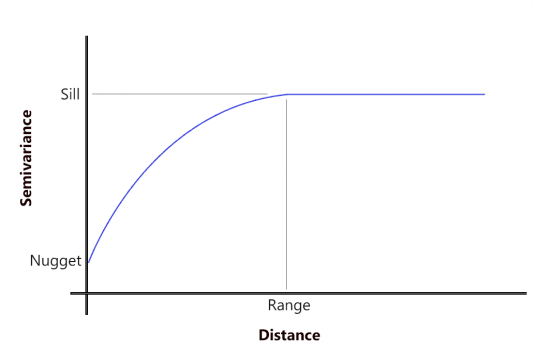
The semivariogram depicts the relationship until it hits the sill where further samples are no longer correlated. The purpose is to fit a mathematical function that models the trend in your semivariogram.
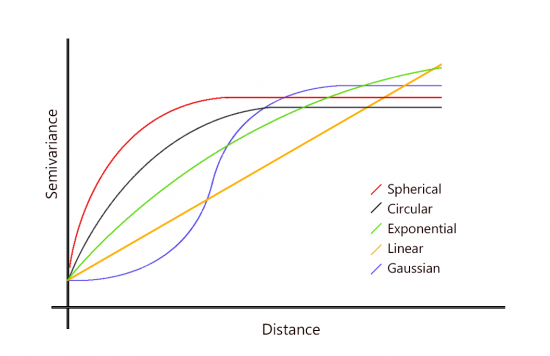
For example, you can select a semivariogram that is:
Kriging Interpolation
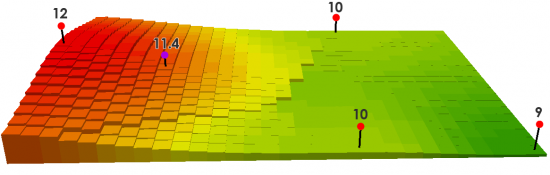
Kriging is an interpolation technique that leverages the spatial correlation between samples to predict values at unsampled locations. But the main difference is that you can build it using the mathematical function obtained from the semivariogram.
Here are the different types of kriging available in geostatistics:
Co-Kriging adds a second related variable so you can improve the prediction with secondary information. For example, to predict precipitation change in mountainous areas, you can add elevation data as a covariate to rainfall amounts.
Empirical Bayesian Kriging (EBK) can help by treating local variance separately. Instead of having a similar variance to a whole extent, EBK performs kriging as a separate underlying process in different areas. It still performs kriging, but it is done locally.
Universal Kriging adds trend surface analysis (or drift) with ordinary kriging by accounting for trends.
Indicator Kriging carries through ordinary kriging with binary data (0 and 1) such as urban and non-urban cells.
Probability Kriging uses binary data (similar to indicator kriging) and estimates unknown points for a series of cutoffs.
Standard Error
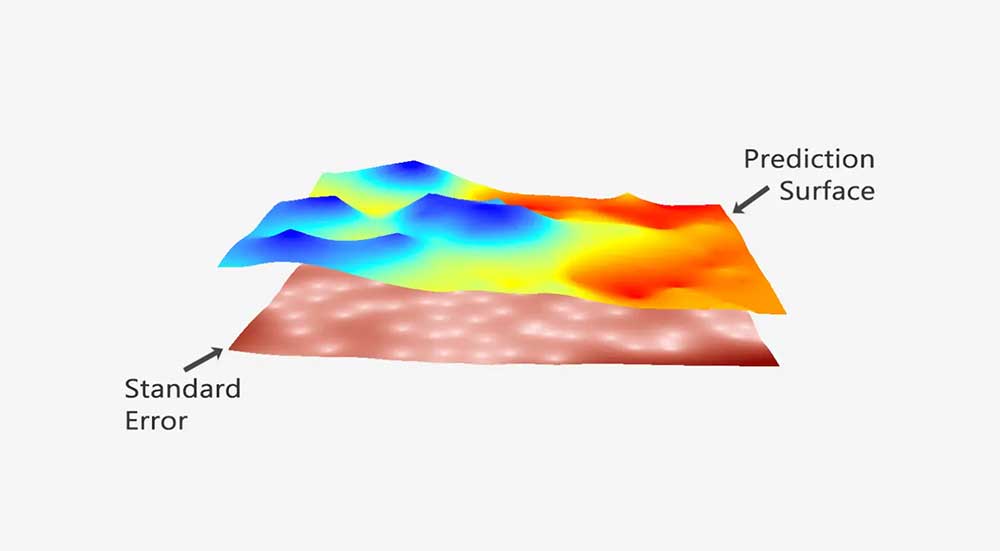
Geostatistics is advantageous because it assesses uncertainty for unsampled values with a standard error surface map. A standard error map represents a measure of confidence of how likely that prediction will be true.
Standard error assesses the robustness of your kriging model. By comparing actual versus predicted values, it assesses uncertainty by building a surface of residuals.
In general, you get a higher standard of error when you have a sparse amount of observations. When error exceeds a critical threshold, expert knowledge can contribute to the process of the variogram.
Applications and Uses
Geostatistics was originally developed for the mining industry to estimate and manage ore and mineral resources.
But geostatistics applies to various types of spatial phenomena with local variation. For example, we use it to:
- Predict weather, climate, pollution, and other atmospheric phenomena.
- Assess soil attributes and chemistry which vary at all scales.
- Measure the abundance of fish for a sustainable population in fisheries.
Geostatistics is an emerging field of study in engineering, geophysics, and most natural phenomena.