Huff Gravity Model: Store Customer Predictions
How the Huff Gravity Model Works
If you’re opening a retail store, the first thing you have to understand is ‘how many customers will patron your store’
Because according to distance decay, as the distance between two locales increases, the amount of activity between them decreases.
To help you solve this problem, you can predict the probability of consumer behavior with other competing retail stores with the Huff Gravity Model.
Sounds complicated? But it’s actually not so bad. Let’s go step-by-step on how to calculate the Huff Gravity Model.
Huff Gravity Model – Data Requirements
Because the Huff Gravity Model assumes that a store’s attractiveness is based on its size and distance, you are going to need these 2 essential data sets for this analysis:
- Existing retail locations and store size
- Census tracts (as detailed as possible)
Finally, you will need GIS software to calculate distance and display the model on a map.
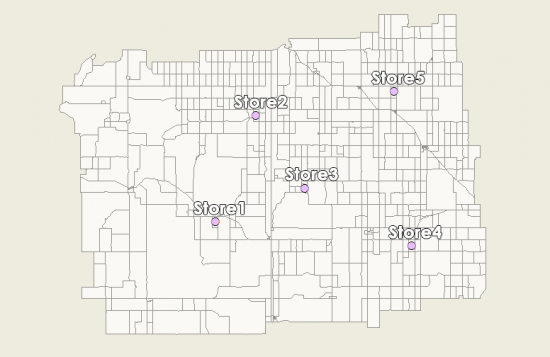
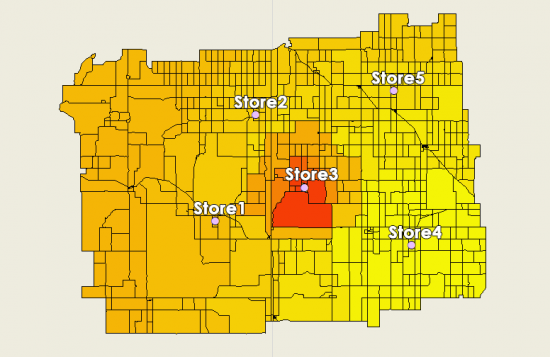
As an illustration, here is where our five retail stores are located with census tracts as the base map.
Now, let’s go through all the steps involved in performing the Huff Gravity Model.
Step 1. Calculate distances from retail stores to census tracts
First, you will take your census data and calculate the distance from each census tract to each retail location. In our example, we have 5 retail stores and 738 census tracts.
- Add 5 fields for distances in the census tract data set (‘dist1’, ‘dist2’, ‘dist3’, ‘dist4’, and ‘dist5’).
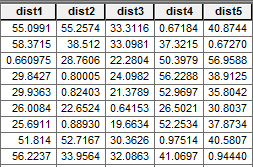
- Calculate the distance for each retail location to each census tract. In ArcGIS, you can use the Near Tool and select each retail store individually.
Now, each census tract will have a distance to each retail store in its respective distance fields. For example, the distances for Store 1 will be in the field ‘dist1’)
Step 2. Incorporate attractiveness with store size and distance
In this step, we will incorporate attractiveness for each retail location. To clarify, attractiveness is related to the store size (as in square footage) and is inversely proportional to distance.
- In the census tracts data set, add 6 fields to hold the attractiveness score for each retail store and a total score (‘attract1’, ‘attract2’, ‘attract3’, ‘attract4’, ‘attract5’ and ‘totattract’)
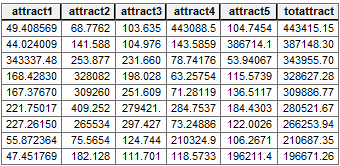
- Attractiveness uses distance and the size of retail location. Take the size of the retail store and divide it by the drive time (or distance square). For example, ‘attract1’ is the square footage of 200,000 for retail store 1 divided by ‘dist12‘.
attract1 = 200000 / ( [dist1] * [dist1])- Finally, in the ‘totattract’ field, sum up all the attractiveness scores. (‘attract1’ + ‘attract2’ + ‘attract3’ + ‘attract4’ + ‘attract5’)
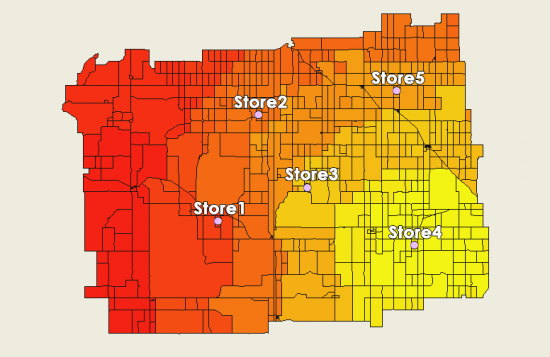
When you plot this on a map, retail store 3 will attract this census tract the most based on its distance and store size.
Step 3. Measure the probabilities for each retail store’s market share
Now that we have each retail store’s attractiveness score, we can start calculating the probabilities of where shoppers are most likely to go for each census tract.
- Add fields for each retail location which will be percentages. (‘marketshare1’, ‘marketshare2’, ‘marketshare3’, ‘marketshare4’ and ‘marketshare5’)
- Take the attractiveness score for each retail location and divide it by the total attractiveness. (‘attract1’ / ‘totattract’)
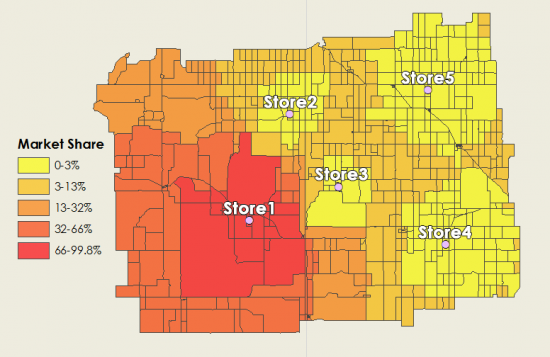
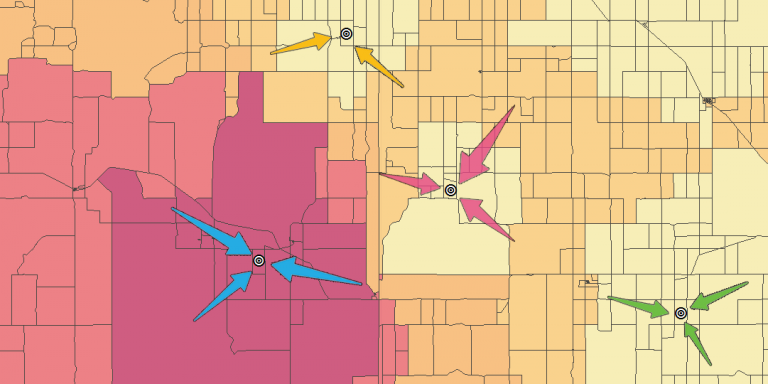
When close to a retail store, it will capture a large share of the market – hence higher values in the color red. Equally important where other stores are located, it will capture that market share. In particular, the yellow patches indicate there are other retail stores with a higher probability of grabbing that share of the market.
How about where there are census tracts at distances equal between two retail stores?
For these retail stores, the market share is more “up for grabs” and could potentially go to either retail store. In other words, this means that the probability could be at about 50% in these census tracts.
Huff Gravity Model Formula
This isn’t too important to know and I wouldn’t recommend memorizing it. But here is the formula for the Huff Gravity Model:
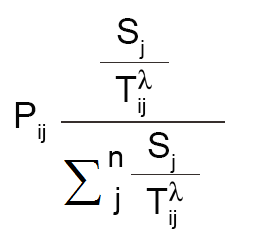
Pij: Probability of a consumer at point i traveling to retail location j
Sj: Size of the retail location
Tij: Travel time (or distance) from the consumer at point i to travel to location j
As the size of a retail store increases, the probability increases that a consumer will patron a retail location. Similarly, the likelihood that customers will frequent that particular store decreases when distance increases (because it’s in the denominator).
Don’t forget that the sigma notation simply means that you are summing values. As shown above, in step 3, all this formula represents is taking the attractiveness score and dividing it by the sum of all retail stores’ attractiveness – which should equal 100%.
How Many Customers Will Visit Your Store?
If you are going to invest the time and money to open a store, you should run the Huff Gravity Model.
All you need is a bit of GIS data and software to get things started. And let’s not forget to incorporate demographic data like the United States Census or Esri’s tapestry market segmentation data.
As shown today, the two big details you will need are the size of the store and distance coupled with the census tract population. With these variables, you are on your way to better predicting consumer behavior and the probability they will visit your store.
If you want to optimize your store’s location, read more about the location allocation analysis.


The Huff model is not a “gravity” model. It incorporates distance decay but does not rely solely on convenience and distance as a measure of attractiveness. Reilly’s model is more true to a gravity model.
First of all, thanks for explaining step by step this process.
Would you mind explaining what you mean exactly with “each census tract”?
Check out using Maptitude and the Huff Gravity model : https://www.youtube.com/watch?v=9d0Ccsj2Ct4