Esri Business Analyst: Insights in ArcGIS and AGOL
What is Esri Business Analyst?
Spatial data is a valuable asset for business professionals. With the ability to analyze and interpret location data, you can make informed business decisions and uncover new opportunities.
If you work in business intelligence, you have probably come across GIS and geospatial software like Esri Business Analyst in your job.
The ability to leverage spatial data efficiently, and make the most of the information it contains, is crucial to future-proofing any organization. But with so much location data, how do you know what is relevant to you?
In this article, you will learn about the many ways the Esri Business Analyst extension can help you leverage your spatial data to solve business-related problems and gain valuable insights.
How Does Esri Business Analyst Work?
Esri Business Analyst is a suite of tools that allow businesses to create analytical reports and visualizations of data to better understand their customers, markets, and operations.
Each analysis and reporting tool is business-oriented and enables business analysts to create data-driven decisions in areas such as the following:
Let’s break down some of the tools that are available through the Esri Business Analyst toolset.
Business Analysis Tools
First, you require an Esri Business Analyst license to use these tools. In ArcGIS Pro, business analysis tools are part of their own toolbox. Then, they are further divided into the following toolsets:
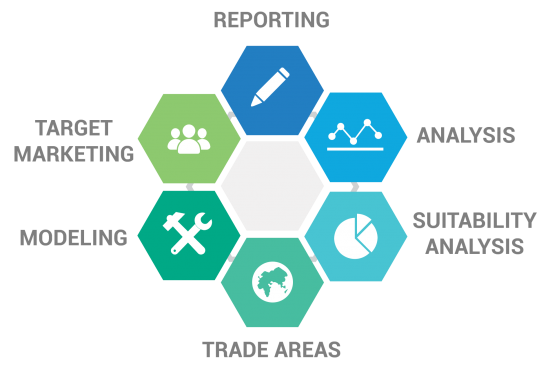
Here are some of the individual tools that are available to help solve common problems for any business visual reports, data visualization, analytics, data profiling, and modeling.
Drive-Time Analysis
The drive time tool is a type of data visualization technique that displays all the streets that can be reached from a start point. By using a drive-time analysis, you can understand the catchment area for any business and know who your customers are likely to be.
Customer profiling
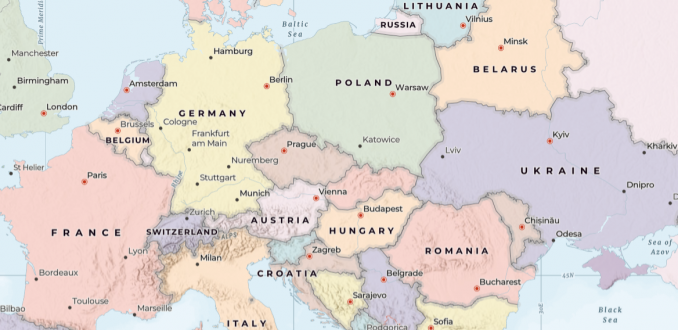
The Living Atlas of the World contains global data that covers 90% of the world’s population and 135+ countries. By using over 15,000+ variables on market data, you can incorporate it into any type of business analysis like drive-time, territory design, and more.
Territory Design
If a business has multiple sites, you can use the territory design to balance where new stores will be built. This spatial analysis helps you find underserved areas for customers based on location or demographics.
Geoenrichment
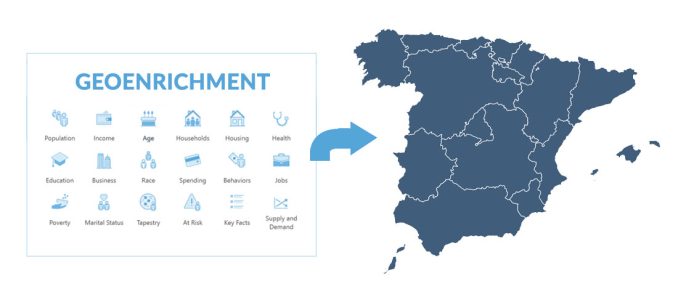
Geoenrichment is the process of adding additional data to your data based on its location. For instance, you can add attributes from tapestry segmentation which includes everything from demographic information to consumer spending and socioeconomic data.
Process Modeling
If you have any repetitive analysis that you need to re-run a process in an iterative way, then you can add them to a model. By leveraging ModelBuilder, it’s how you automate any type of workflow through Esri Business Analysts.
Web-based Business Intelligence
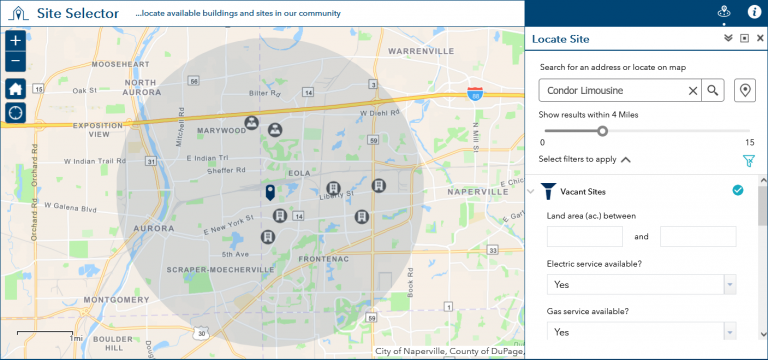
ArcGIS Online (AGOL) is a cloud-based service that delivers online maps, authoritative data layers, and analysis tools through a single, easy-to-use web interface.
Some of the capabilities include business analytics, data collection, report creation, and operational dashboards. But its main advantage is how you can share it with anyone who has an internet connection.
Business Intelligence Dashboards
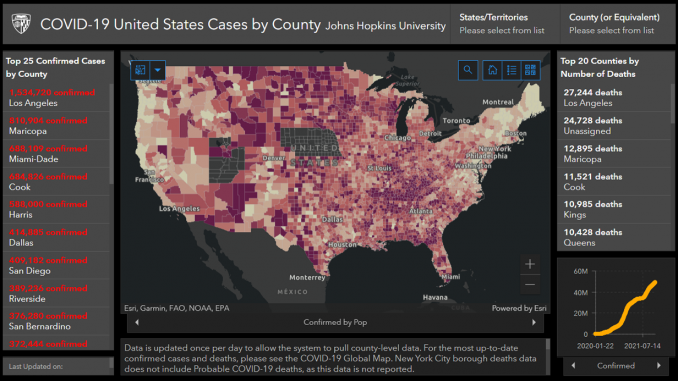
ArcGIS Online makes it possible to share interactive reports and intuitive dashboards within your organization or with the general public. But you can also take it a step further by integrating your spatial data with applications like Microsoft PowerBI for even more powerful business insights.
ArcGIS Business Analyst Web App
The online application is a way to access market analysis tools, data enrichment, and related tools in a web browser. Depending on the type of analysis, you have most of the tools from ArcGIS Pro available as well in the ArcGIS Business Analyst Web App.
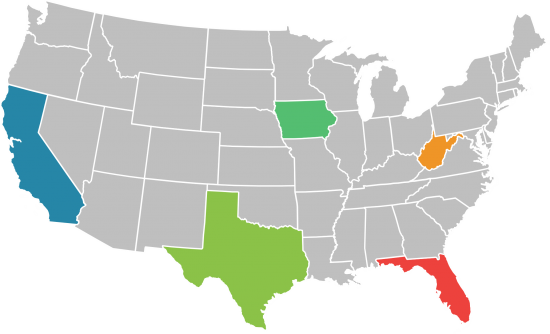
You start by creating a project and building a map. Next, you can include any of the following functionality in your ArcGIS Business Analyst Web App:
- Enrich data from 15,000+ variables related to your analysis
- Create simplified business analysis workflows
- Geocode existing locations or pull from a spreadsheet of potential addresses for your project
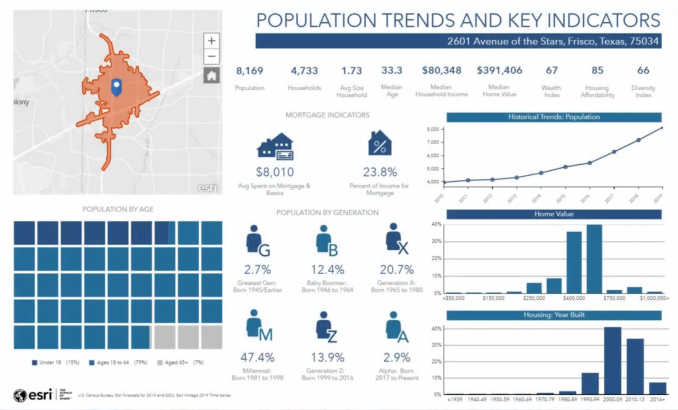
- Produce and customize infographics to highlight key indicators
- Run an analysis in your web browser, add data, or perform a market analysis
- Create powerful visualizations with color-coded thematic maps for socioeconomic factors like household income
Esri Business Analyst
Data analysis is a critical part of any business, and Esri Business Analyst offers a variety of tools that can help you make better decisions.
Although this suite was first designed for desktops, now you have a whole host of web-based tools that you can use to create data visualizations and interactive dashboards for more informed business decisions.
Because these tools can help you track your business performance, you can uncover insights from your data, and make recommendations for improving future results.
What do you think of the Esri Business Analyst tools? Please send us your comments and questions by using the form below.


