How to Calculate Mean Absolute Error (MAE) in Excel

Mean Absolute Error (MAE) measures how far predicted values are away from observed values.
It’s a bit different from Root Mean Square Error (RMSE). Overall, it’s just a couple of simple steps and applying formulas in Excel. MAE performs the following 2 computations:
- MAE sums the absolute value of the residual
- Divides by the number of observations.
Let’s go over an example of how to calculate MAE in Excel. To complete this tutorial, you will need a set of observed and predicted values. Also, we assume you already have Microsoft Excel installed.
Mean Absolute Error (MAE) is a statistical measure that quantifies the average magnitude of the errors between predicted and actual values to help understand the accuracy of a predictive model.
Step 1. Enter headers in the first row of Excel

In A1, type “observed value”. In B2, type “predicted value”. In C3, type “difference”. These are just headers to help identify which values belong to predicted or observed.
Step 2. Place values in columns

If you have 10 observations, place these observed values in cells A2 to A11. In addition, you will type in predicted values from B2 to B11. But you can enter as many values as you’d like in these columns and adjust the following steps accordingly.
Step 3. Find the difference between observed and predicted values

In columns C2 to C11, subtract the observed value and predicted value. C2 will use this formula:
=A2-B2You will have to copy and paste this formula all the way down to the last row.
Step 4. Calculate the mean absolute error (MAE)

In cell D2, we can calculate MAE by using the formula below:
=SUMPRODUCT(ABS(C2:C11))/COUNT(C2:C11)After entering this code in Excel, cell D2 is the Mean Absolute Error value.

How to use MAE in GIS?
MAE quantifies the difference between forecasted and observed values. For example, you could compare satellite-derived soil moisture values and compare them to what was collected in the field.
In this case, the satellite-derived soil moisture values are the forecasted values. Finally, the network of stations on the ground measuring the true soil moisture values are the observed values.
We often use MAE to see how correct models are like digital elevation models.
- FORECASTED VALUE: Satellite-derived soil moisture value
- OBSERVED VALUE: Ground station network soil moisture measurement
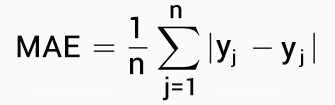
As described above, here is the MAE Formula:


I guess Seth is right since there is no array 2 for the SUMPRODUCT command. SUM will be sufficient for the formula.
Thank you, you helped me a lot through these post, kindly share other statistical calculation equation, I need d=1 and bias etc
To the comment made by seth, no the “SUMPRODUCT” is the correct function to use.
I guess the “SUMPRODUCT” in the step4 should be sum.