Quantile Classification in GIS
Quantile Classification in GIS
Quantile classification divides classes so that the total number of features in each class is approximately the same.
This type of classification is useful for showing rankings and ordinal data. But quantile classification can be deceiving because it doesn’t show how much difference there is between each rank.
If you create more classes, this would partially improve it. But it wouldn’t completely resolve it either.
So, let’s examine a bit closer how this type of classification works:
How is Quantile Classification Used in GIS?
If you want to show the ranking of area for each state in America, you can use quantile classification.
If you generate 5 classes, this means that 10 states will reside in each class.
- The first class will have the 10 largest states in terms of land mass.
- The last class will have the 10 smallest states.
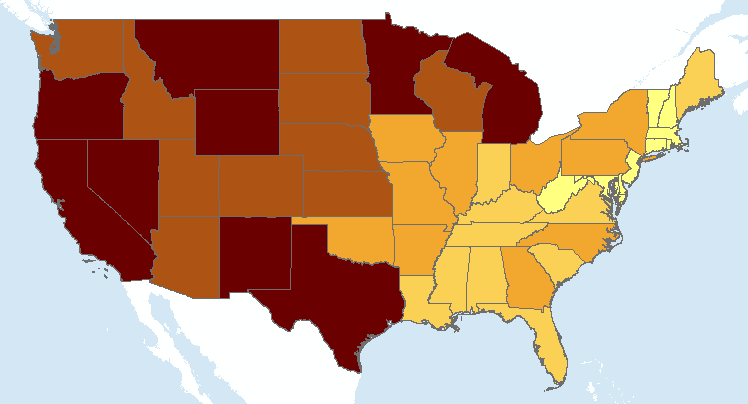
When you use the quantile map classification with 5 classes, it will look like the following:
It’s easy to see states like Texas, California, and Montana are in the top 10 largest. The east coast states are definitely the smallest. This makes sense. But let’s validate this map classification.
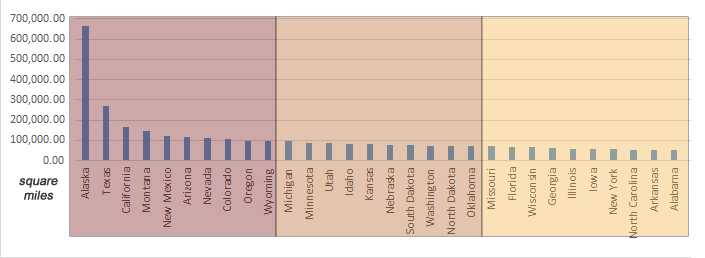
First, we can start looking at the area from the attribute table. The column chart below arranges the area from largest to smallest. It inserts breaks every 10 states based on size.
Here are the first 3 sets of breaks:
Finally, here are the last 2 sets of breaks:
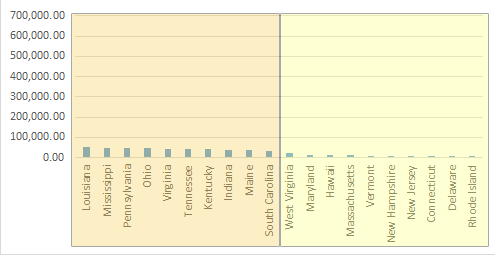
From this chart, we can clearly see each grouping of 10 states and how they rank in terms of size.
Remember that you can only use attribute data with valid numerical values for quantile classification.
Why Use Quantile Classification in GIS?
Quantile classification is ideal for ordinal data. When you have a clear ordering of the variables, then this is one of the advantages of quantity classification.
If you want to rank data into categories such as high, medium, and low, this is another opportunity to use quantile classification.
In our example, we rank state sizes into 5 even classes. Each class consists of 10 states and their areas.
Our choropleth ranks state sizes so that the total number of features in each class is the same.
Do you want to learn more about data classification? If you made it this far, then try reading our other articles below: