Story Maps: The Power of Storytelling with Maps
Story meet map.
Story maps (also known as storytelling maps) are an interactive way to display a particular event, issue, place, or trend with a focus on location.
If you want to explain anything, there’s nothing better that can build a stronger connection than storytelling.
Not only do story maps showcase a story, but they also enable us to see it through the eyes of someone else.
Let’s see some examples of story maps as well as their advantages.
Why should you create a story map?
Story maps are generally for non-technical users. For instance, it’s perfect for decision-makers with limited capability for any type of spatial analysis. Generally, it’s just for visual purposes only so there’s no need to have a strong understanding of how GIS works.
A story map usually contains text, sound, photos, or videos to paint the portrait of the story. In general, they are easy to use and set up with a range of tools and functionality to help you tell the story in a visual and geographic way.
Each story map often leverages ready-to-use layers stored on the cloud from ArcGIS Online. For example, it allows you to add data layers from the Living Atlas of the World, with contributors from around the world.
Types of Story Maps
Authors from around the world are creating story maps every day. Themes can range from anything from climate change to racial equality.
The story map interface makes it easy to navigate with a wide collection of categories to choose from. Some of the categories are:
For example, here is a showcase of story maps with a curated selection of stories provided by Esri.
Examples of Story Maps
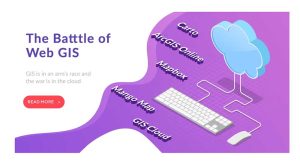
Despite the common misconception, that story maps are unique to Esri, Mapbox also boasts the functionality for story maps. Instead, it’s an interactive storytelling map in Mapbox.
Either way, you can probably spend hours viewing the story map collections. Here are some of our favorite story maps from both Mapbox and Esri:
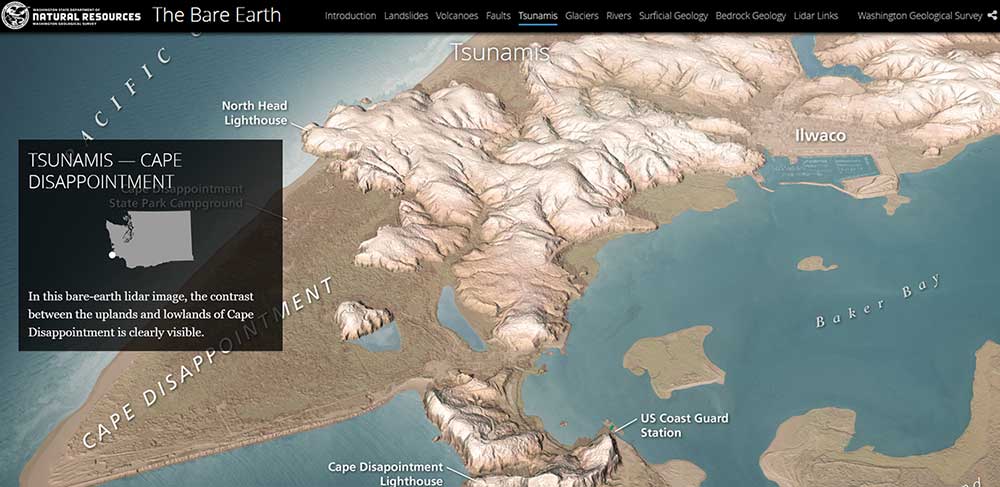
The Bare Earth
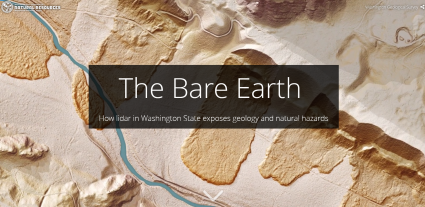
The Bare Earth
How lidar in Washington State exposes geology to show the earth’s surface where trees and vegetation obscure the landscape.
Saving the Nile
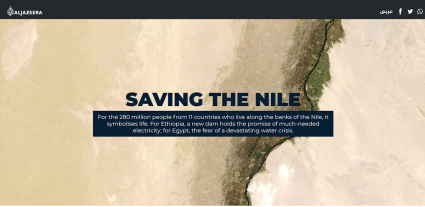
Saving the Nile
A new dam holds the promise of much-needed electricity for Ethiopia. But for Egypt, there is also fear of a water crisis.
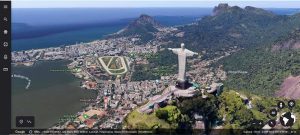
49 Mile Scenic Route
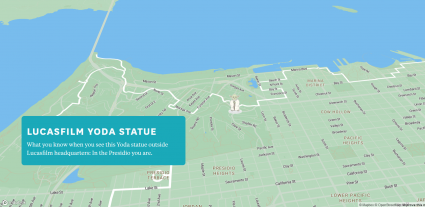
49 Mile Scenic Route
Explore San Francisco by the 49-mile route with a new walkable, bikeable, transit-friendly, and car-unfriendly route.
Washington Ice Age
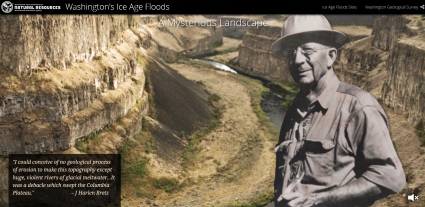
Washington Ice Age
A story map that highlights the powerful floods during the ice age that shaped the rugged terrain of the US state of Washington.
Conclusion
Inside each of us is a natural-born storyteller. When you combine this with location, you get the story maps.
If you’re looking for some visually inspiring maps, it’s a great place to start. They’re also a lot of fun to create!
What are some of your favorite maps?
Please let us know with a comment below.


Is ArcGIS the only software that can produce story maps or are there alternatives?
I know that Mapbox has “Mapbox Storytelling”. I think it’s also possible in CARTO as well.