ArcGIS for Power BI
ArcGIS for Power BI
ArcGIS for PowerBI helps users analyze and visualize location-based data directly in Microsoft Power BI reporting.
There’s no need to download it because it’s available to all Power BI users out of the box. Plus, subscriptions are also available for more capabilities such as:
Today, we will discuss some of the main benefits of using ArcGIS for Power BI.
Data Access
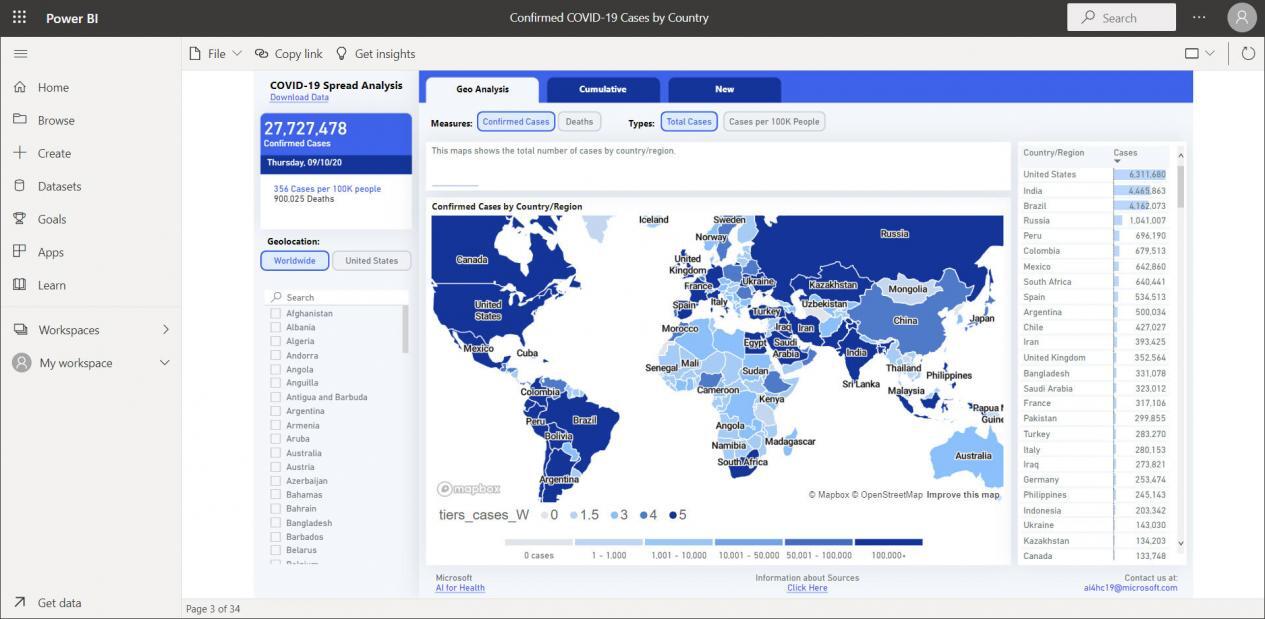
One of the biggest advantages of using ArcGIS for Power BI is that you get access to the largest geospatial repository of online data in the world through ArcGIS Online.
First, you will have to sign in to your ArcGIS Online account to access your data. Next, you just drag your data into Power BI and symbolize.
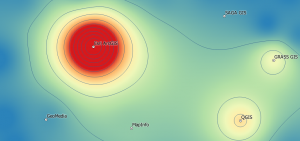
There are lots of styling options with different color ramps and designs. For example, graduated color ramps and heat maps are some of the most popular.
In addition, a major benefit is how you can add reference layers to maps. By changing your basemap, you can give readers more context viewing maps from your dashboard.
Infographic Cards
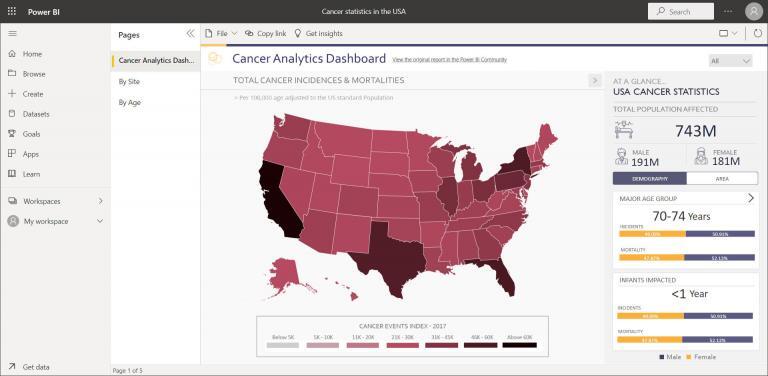
ArcGIS for Power BI contains a dynamic way to create visually appealing analyses and reports such as demographics.
Because users can respond to your selection in a dashboard, infographics are an engaging way to convey information that is both aesthetically pleasing and attention-grabbing.
Not only will this functionality keep your readers interested in the content, but it gives more context with supporting information making it easier to digest.
Geospatial Analysis
The biggest advantage of using ArcGIS for Power BI is how it adds location intelligence with a set of geospatial analysis tools. This means that you’ll have more control of spatial analysis with tools such as the following:
Even though Power BI already has a rich set of analysis and data exploration tools, ArcGIS for Power BI focuses on spatial analysis. Not only can businesses use these tools to create interactive dashboards, visualizations, and reports, but they can extract insights and discover patterns from data to make data-driven decisions.
READ MORE: The Periodic Table for Spatial Analysis
ArcGIS for Power BI
If you’re looking to either gain access to a vast amount of geospatial datasets or add functionality with a rich set of geospatial tools, then ArcGIS for Power BI is the perfect addition to your toolbelt.
Not only can you connect to ArcGIS data sources like maps, tables, and base layers, but you add location intelligence tools for analyzing data.
Then, you will be able to integrate these spatial analysis tools into your Power BI reports and dashboards.
ArcGIS and Power BI sound like the perfect match to create interactive visualizations. Have you ever tried it before? Please send us your comments using the form below and let us know what you think.