How Does ArcGIS Insights Work?
What Is ArcGIS Insights?
ArcGIS Insights is the fusion of spatial analysis from GIS, open data science, and BI workflows which are all integrated into one place.
It’s “cards driven” like Google Charts with a drag-and-drop interface to connect to databases and then perform data analytics.
ArcGIS Insights is a customizable, visual, and intuitive way to analyze data and maps with shareable models and workflows.
Let’s explore ArcGIS Insights with more detail and what you’ll need to get started.
Connect to database
ArcGIS has one of the most flexible ways to connect to various types of databases. For example, if you want to use Excel, just drag and drop an Excel file. Then, you can enable locations from XLS with geocoded addresses.
Not only does it support a wide range of geographic data formats, but you can also connect to database connections such as SQL Server, HANA, and Oracle. Furthermore, you can enrich any type of data such as through demographic enrichment capabilities.
If you want to create relationships between 2 datasets, this becomes a “derived dataset”. From here, you can apply filters as a card or from the master. But this will affect all previous cards. The main feature is how you can produce charts, with extra capabilities like switching from numeric to string field or grouping features.
Analytics
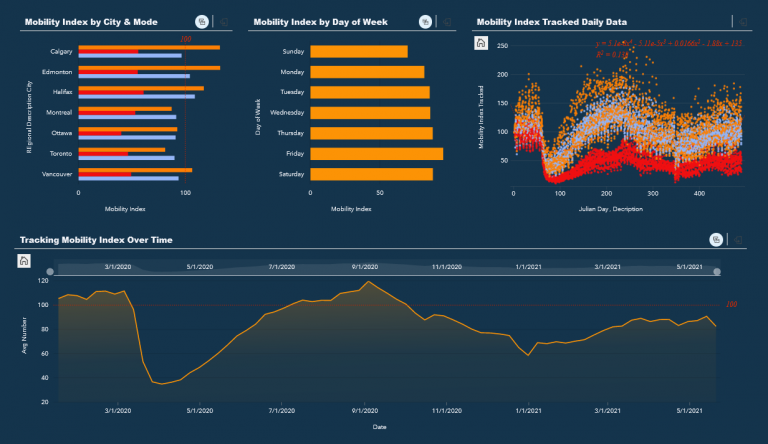
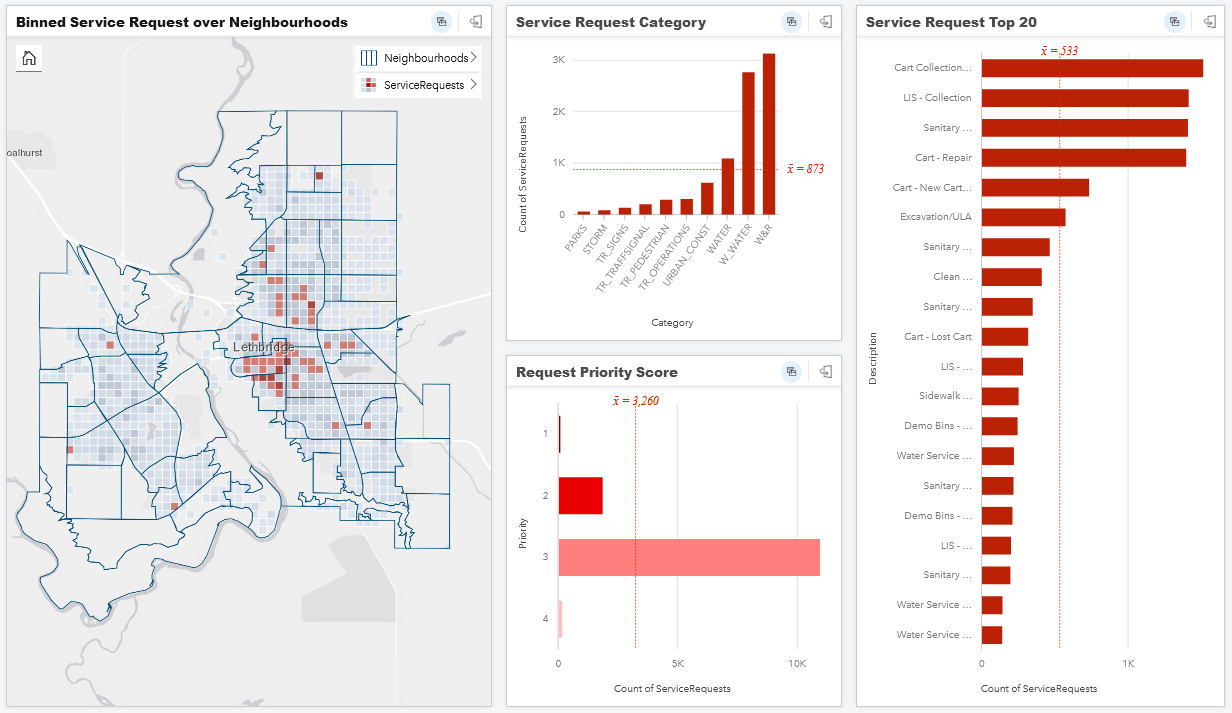
After you connect to your data source, ArcGIS Insights is equipped with tools like spatial analysis from GIS, open data science tools, and BI workflows. But the main reason you used it is for its powerful visualizations through cards.
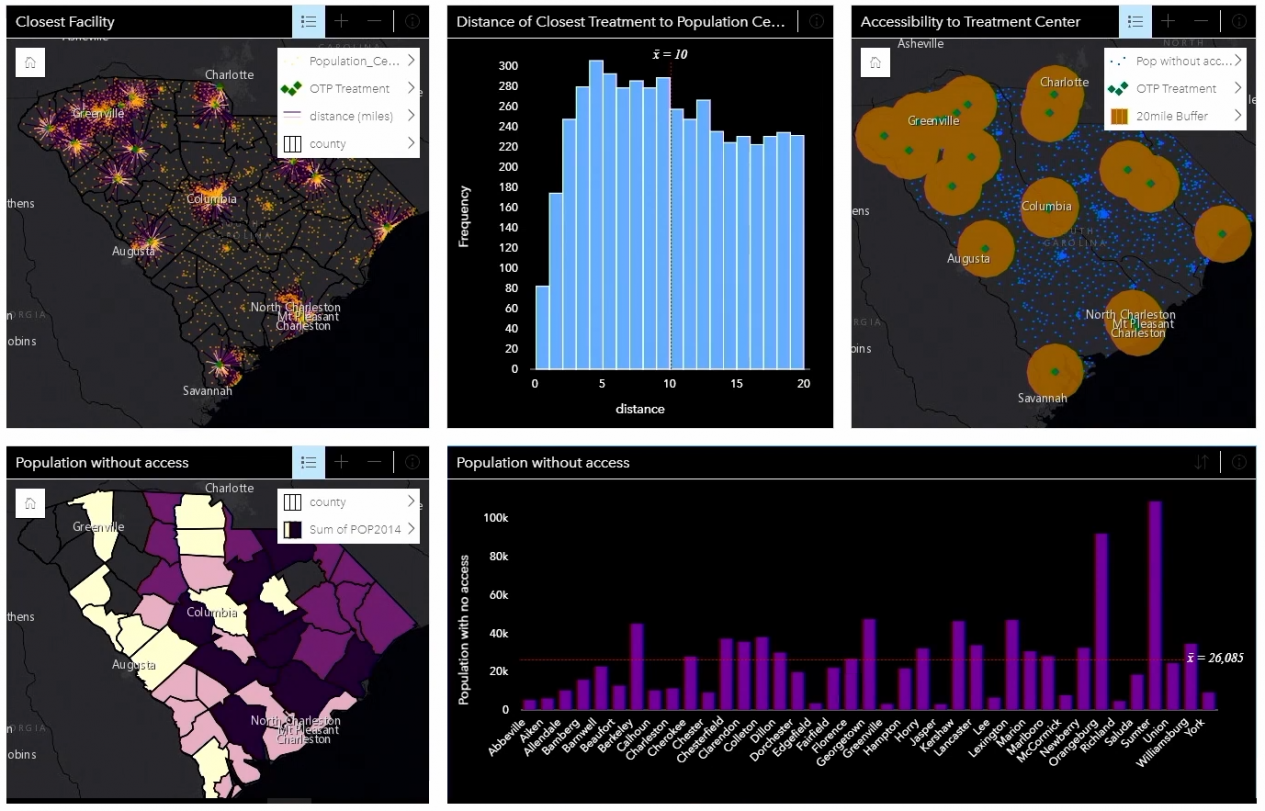
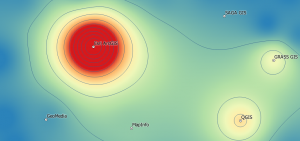
By using analytics cards, it’s all about being interactive and allowing users to filter data on their own selections to explore in their own way. For example, you can use tools for spatial analysis such as buffer time, drive time, spatial aggregation, find nearest, calculate density, and spatial finder.
If you want to augment your data analytical capabilities moreso, you get access to data science tools like R and Python. By using these open statistical languages, you can leverage everything from predictive analysis to data mining. For instance, here is the ArcGIS Insights Gallery with examples of these spatial intelligence and analytical tools.
Workflow and sharing
Whenever you build cards using ArcGIS Insight, it records your workflow. And because it generates a treemap as you move on, you have a usable model to replay workflow and share with others.
For instance, any bubble chart, choropleth map, or scatterplot that you create is tracked as a model. It’s easy to share this model with others to get a repeatable and visual workflow.
Once you share the model with anyone, they can now use that same workflow to automate common analytical tasks. But it’s still possible to edit and customize anything within the model to make it your own.
Pricing
ArcGIS Insights is part of ArcGIS Enterprise and does not cost credits in ArcGIS Online (AGOL). Check out ArcGIS Insights to get familiar with the analytics software from Esri.